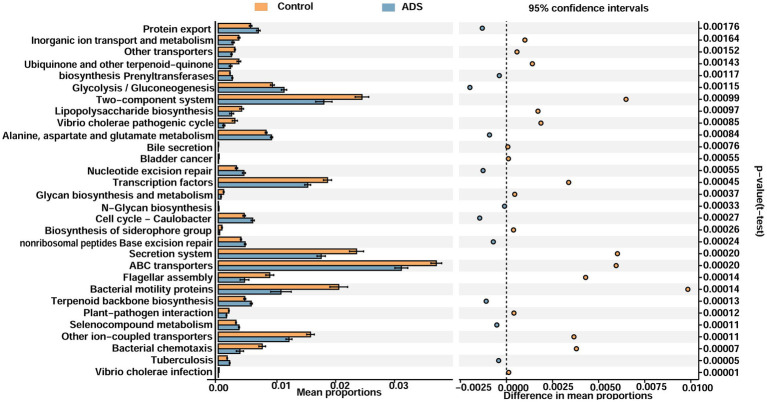
Figure 8.
Functional analyses of the endometrial microbiota of participants in the two groups (level 3). Microbiota differences between groups as shown by differentially functional pathways. Downregulated pathways imply a lower ratio of the mean proportion of expression. Upregulated pathways suggest a higher ratio of the mean proportion of expression. White’s non-parametric t-test was used to calculate p-values.

