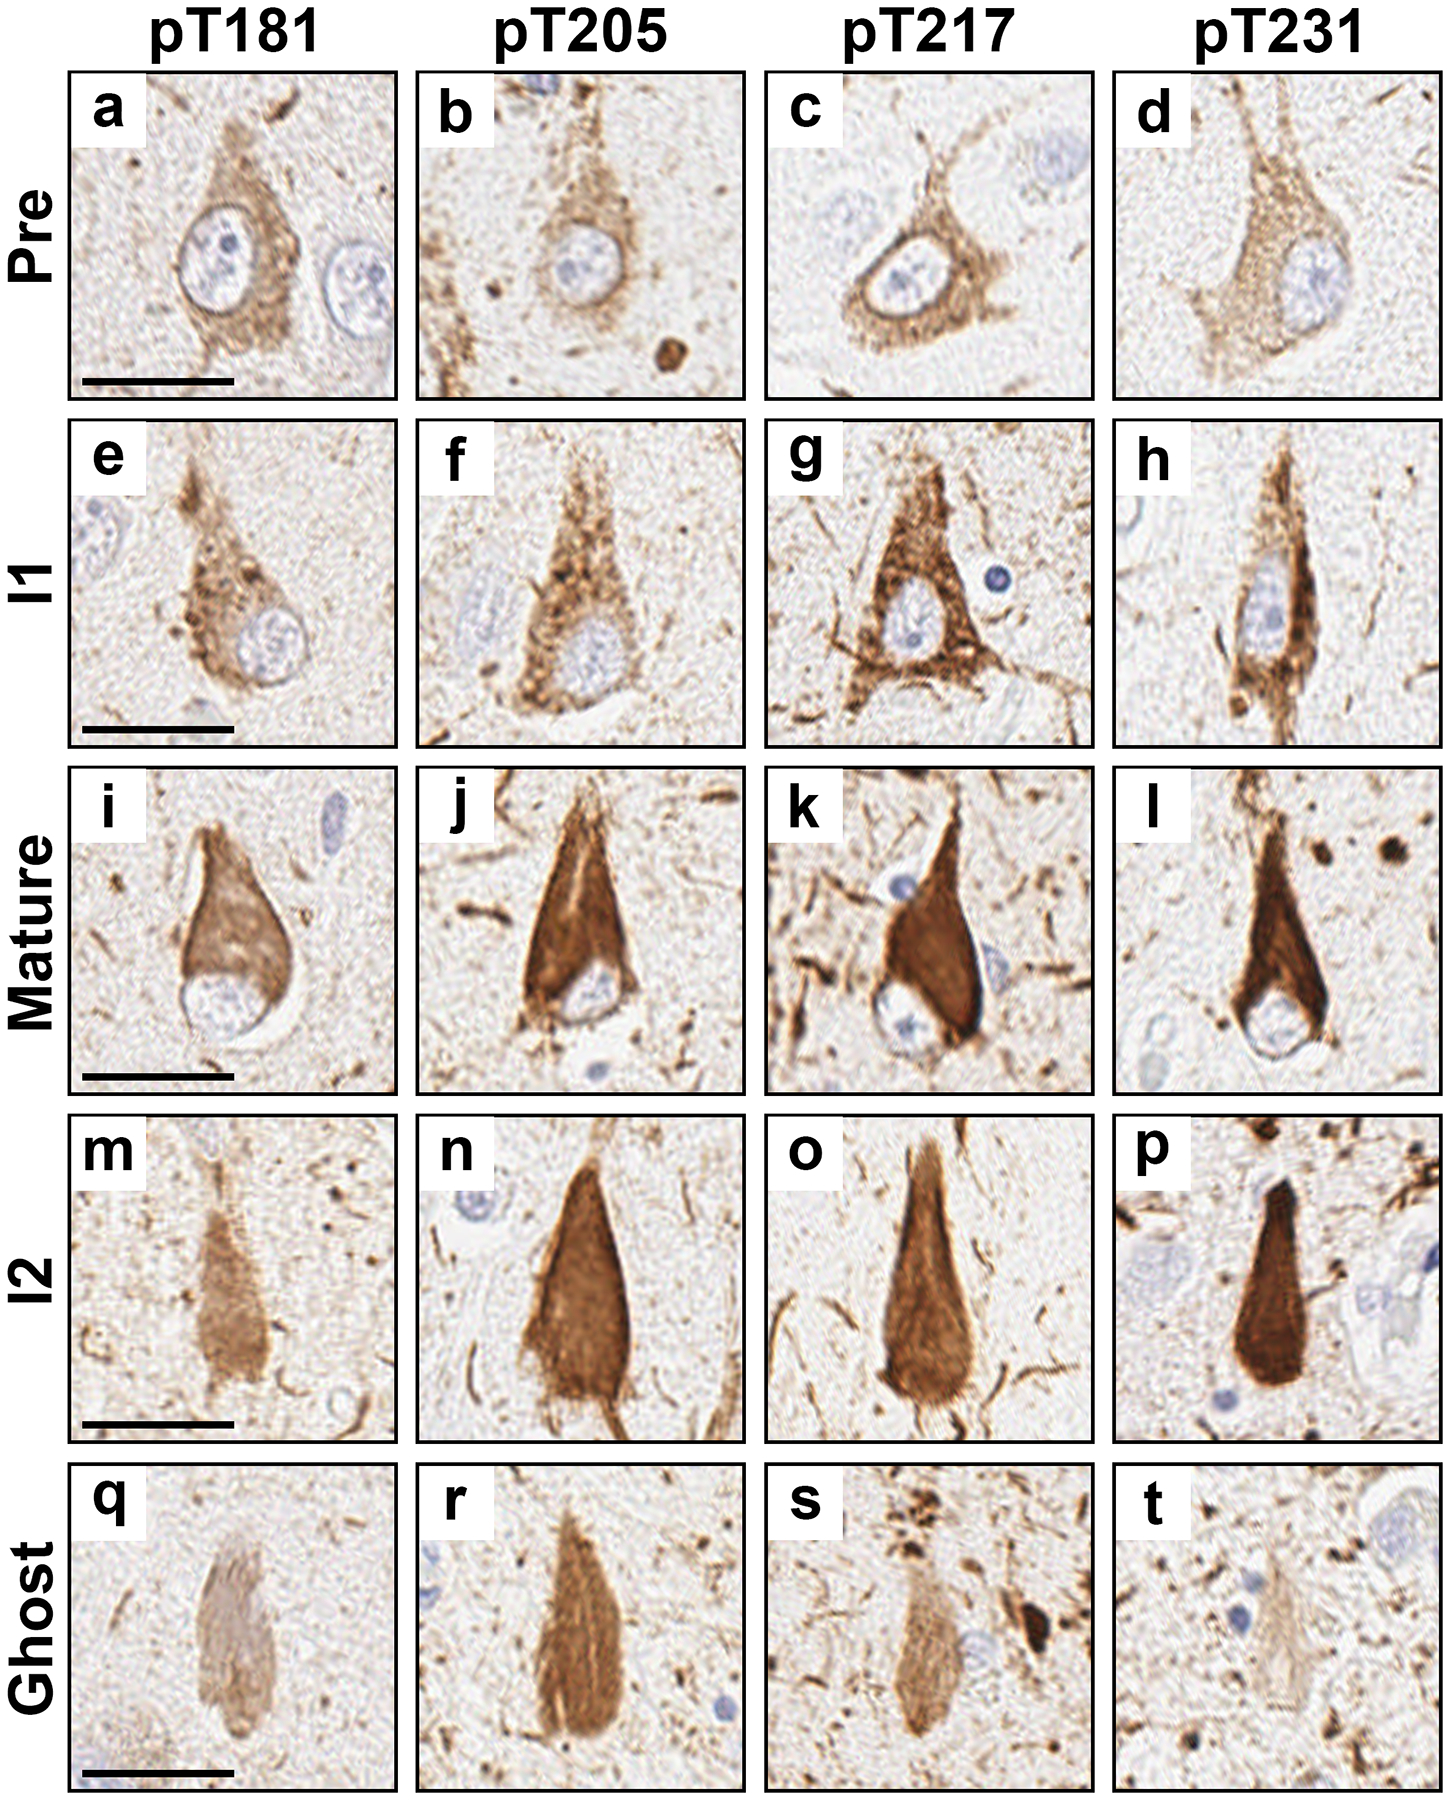
Figure 2.

Examples of neurofibrillary tangle maturity levels and neuritic pathology observed with each phosphorylated tau site. a-d Pretangles, e-h intermediary 1 (I1), i-l mature tangles, m-p intermediary 2 (I2), and q-t ghost tangles. a, e, i, m, and q were stained with the pT181 antibody. b, f, j, n, and r were stained with the pT205 antibody. c, g, k, o, and s were stained with the pT217 antibody. d, h, l, p, and t were stained with the pT231 antibody. All images were taken in the CA1 subsector of the hippocampus except for q, r, and t which were taken in the subiculum. a, e, i, l, and t are from case 18. b is from case 9. c is from case 14. d, h, and n are from case 17. f and j are from case 16. g, q, and r are from case 13. k and s are from case 15. m and p are from case 23. o is from case 22. Scale bar measures 25 μm.
