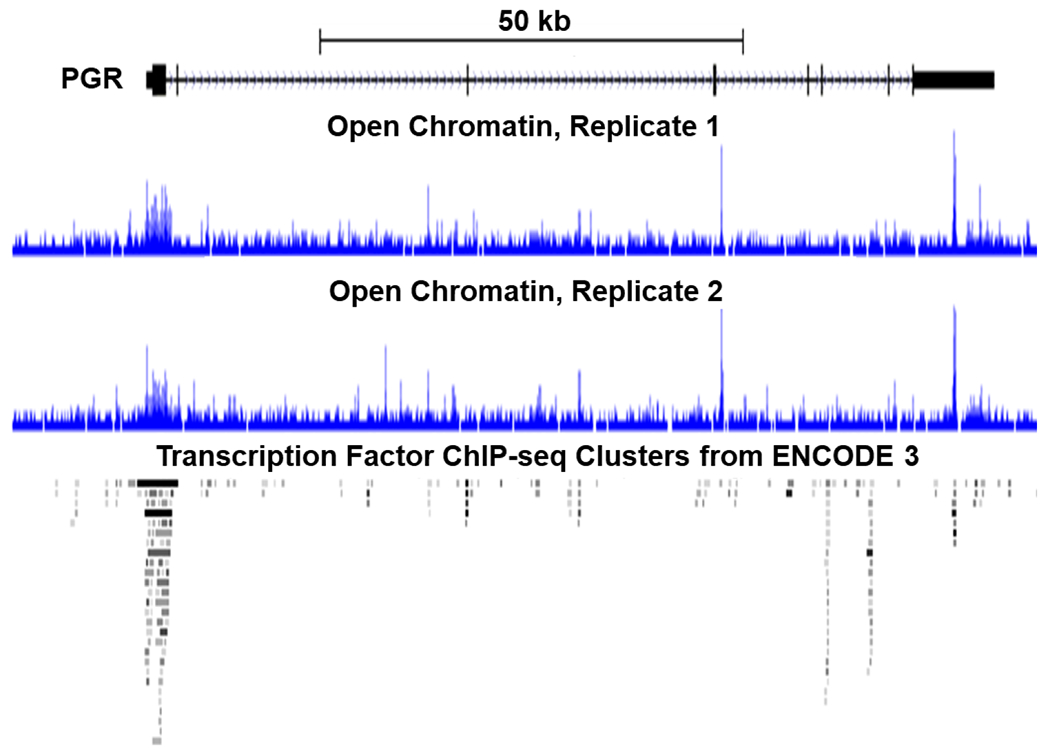
Figure 1.

Open chromatin regions in the PGR locus of term pregnant human myometrial tissues. The track view was modified from the UCSC genome browser using the ATAC-seq data from NCBI accession number GSE137549. The scale bar depicts the size of the displayed genomic region in kilobases. The PGR gene body is displayed to the right of the PGR label and oriented with the first exon on the left and the 3’ end on the right. Arrowheads depict the gene orientation from 5’ to 3’. On the gene body, bigger blocks are exons; smaller blocks are untranslated regions; and horizontal lines in between are introns. The ATAC-seq signals are displayed in histogram-like images for each individual specimen. The transcription factor occupancy patterns of 338 factors from 130 cell lines of the ENCODE (ENCyclopedia Of DNA Elements) 3 project (128) are displayed in a two-dimension density plot to show potential hotspots of transcription factor bindings.
