Figure 1.

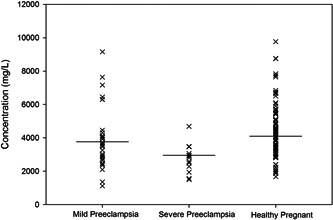
Distribution of serum sodium concentrations in mild pre‐eclampsia, severe pre‐eclampsia and control participants. Horizontal bars represent mean values.

Distribution of serum sodium concentrations in mild pre‐eclampsia, severe pre‐eclampsia and control participants. Horizontal bars represent mean values.