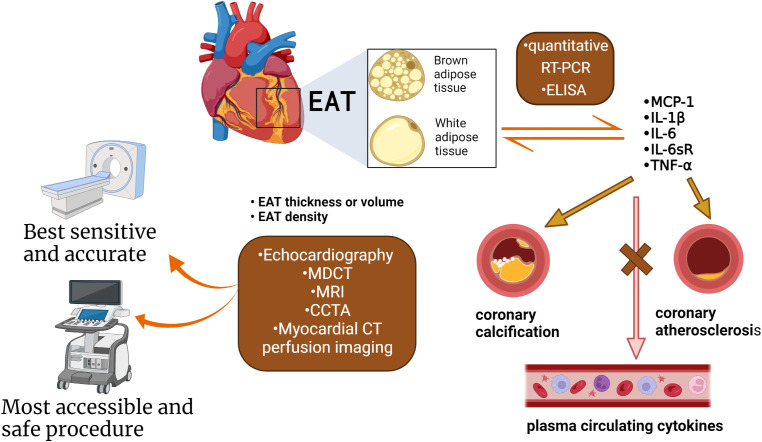
Figure 4.
The methods used to measure the quantity and quality of EAT. Quantification of EAT has seen improvements over the years attributed to the advancements in non-invasive imaging techniques: CT, as well as CMR, PET. Evaluation indicators as thickness, volume, and density. EAT under chronic inflammation shifts from brown fat to white fat. The quality of the EAT was changed, such as inflammatory status, the type of adipokines, and microRNA. The cytokines and adipokines within the EAT can be measured by quantitative RT-PCR and ELISA. Cytokines correlate with the presence of CAD, severity, and coronary artery calcification, but not with circulating cytokines in plasma. EAT inflammation was independent of several clinical variables (obesity, diabetes, or chronic therapy with statins or ACE inhibitors). (Created with BioRender.com).

