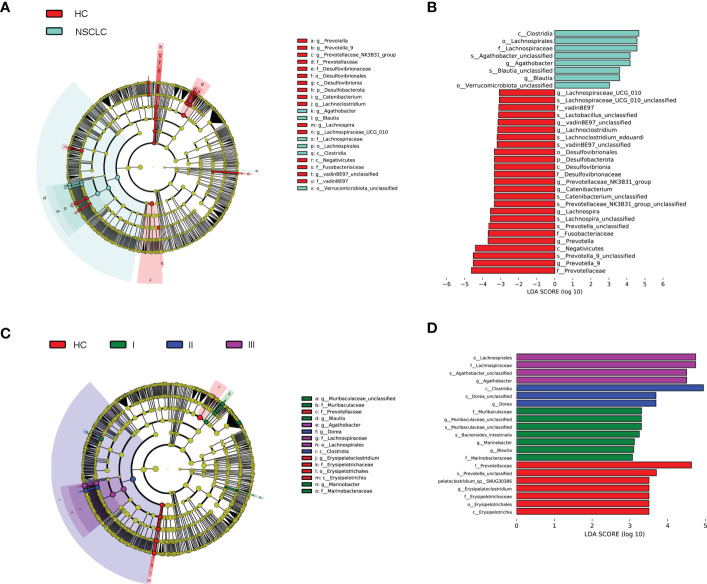
Figure 4.
Linear discriminant analysis (LDA) combined with effect size (LEfSe). (A) Cladograms of the phylogenetic distribution of the microbiota with significant differences between early-stage NSCLC and HC analyzed by LefSe. (B) Histogram of the distribution of LDA values for LEfSe analysis of intestinal flora in the two groups (LAD score ≥ 3). (C) Cladograms of the phylogenetic distribution of the microbiota with significant differences across IPA grade I, grad II, grade III and HC analyzed by LefSe. (D) Histogram of the distribution of LDA values for LEfSe analysis of intestinal flora in four groups of samples (LAD score ≥ 3). The listed bacterial floras are significantly gathered for their respective groups (P < 0.05, Kruskal‐Wallis test).

