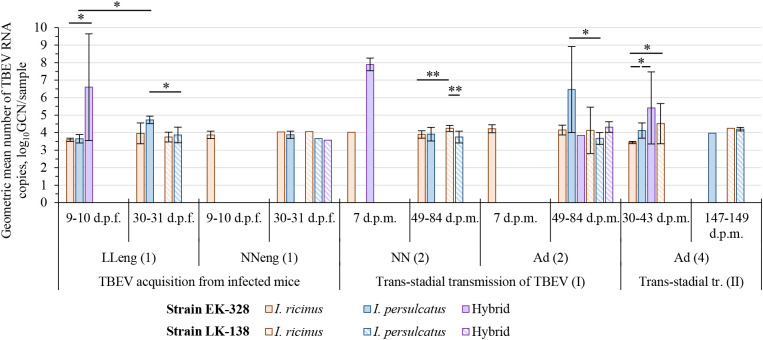
Figure 3.
Geometric mean number of TBEV RNA copies in tick samples at different period after feeding/molting. Engorged larvae (LLeng (1)) and questing nymphs (NN (2)) were studied in pools of three individuals, engorged nymphs (NNeng (1)) and questing adults (Ad (2), Ad (4)) were analyzed individually; the number of TBEV RNA copies is shown for sample (a pool or individual tick). Whiskers show standard deviation; significant differences between groups according to Mann–Whitney U-test (2 groups) or Kruskal-Wallis H-test (3 groups): * p<0.05, ** p<0.001; d.p.f.—days post feeding on TBEV infected mice; d.p.m.—days post molting.

