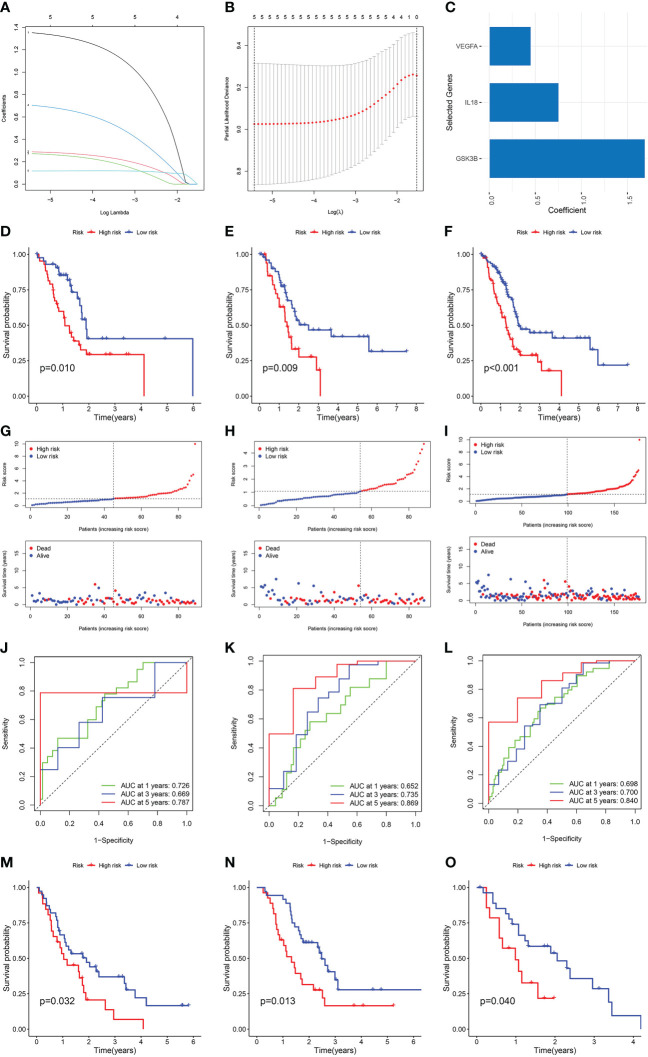
Figure 3.
Construction and verification of the NMRGs-related prognostic model. (A) LASSO regression analysis with coefficient path diagram. (B) LASSO regression analysis with cross-validation curve. (C) Coefficient of three genes in the prognostic model. Kaplan-Meier curve of the training set (D), internal validation set (E) and the whole TCGA dataset (F). Risk score and survival status distribution of training set (G), internal validation set (H) and the whole TCGA dataset (I). ROC curve of the training set (J), internal validation set (K) and the whole TCGA dataset (L). Kaplan-Meier survival curve of GSE62452 (M), GSE57495 (N) and GSE28735 dataset (O).

