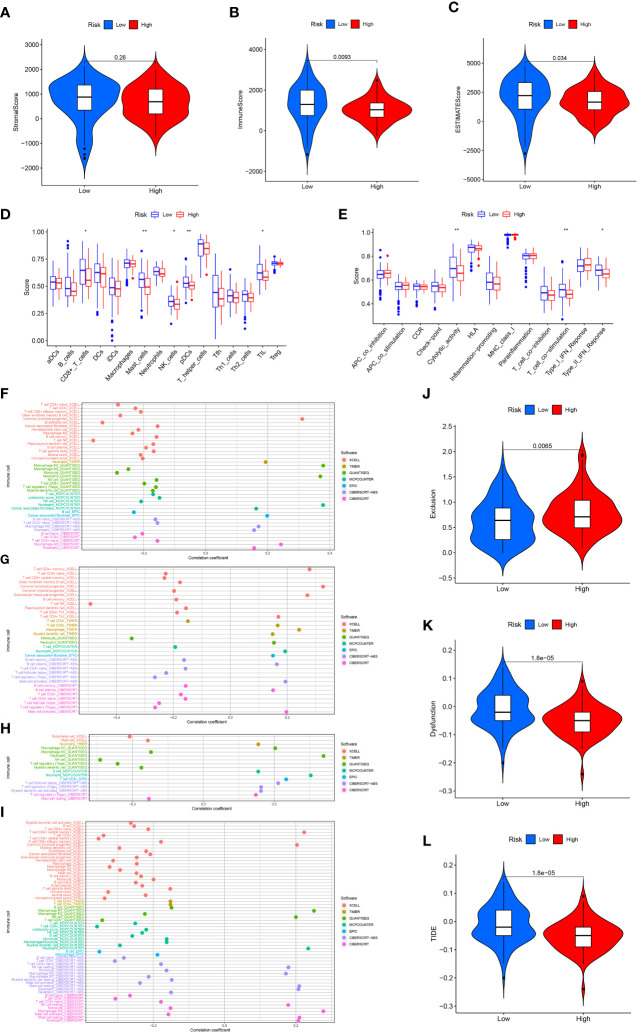
Figure 7.
Immune analysis. Stromal (A), immune (B) and ESTIMATE (C) score in the high- and low-risk score groups. 16 immune cell infiltration scores (D) and the activity score of 13 immune-related pathways (E) in the high- and low-risk score groups. Relationship between immune cell infiltration and risk score (F), GSK3B (G), IL18 (H) and VEGFA (I) expression level. T cell exclusion (J), T cell dysfunction (K) and TIDE score (L) in the high- and low-risk score groups. *p<0.05;**p<0.01.

