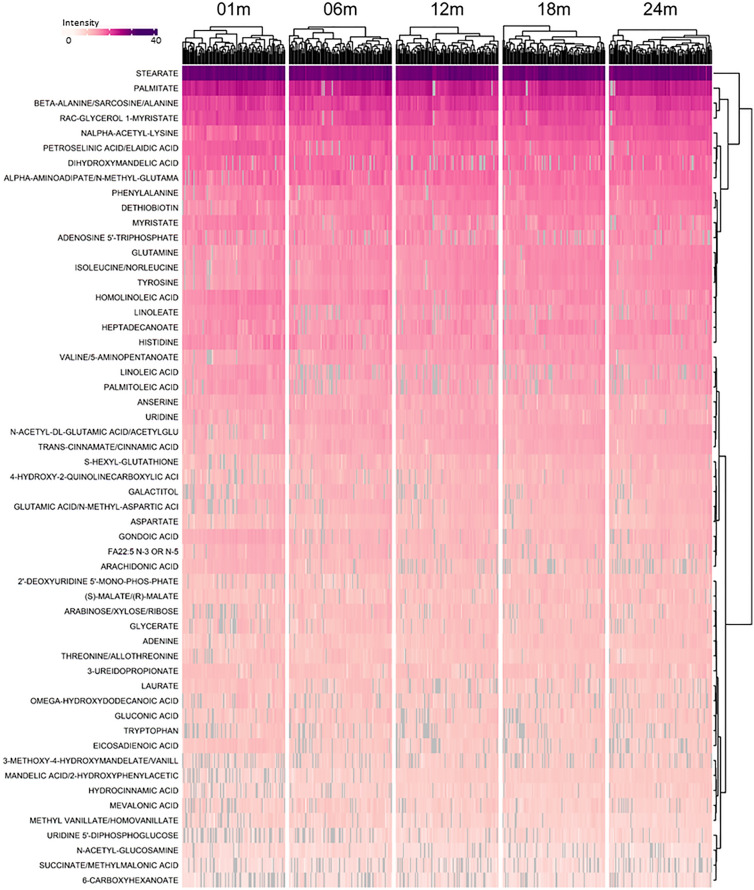
Figure 3.
Longitudinal patterns of metabolite intensity of confirmed fecal metabolites detected in the C18 chromatography column during the first 2 years of life. Intensity presented is standardized by dividing by intensity standard deviation, and ranges from 4.7 to 37.6, with dark purple representing the highest intensity and white representing the lowest intensity. Grey indicates a missing value. Metabolites detected in at least 80% of samples were included. Observations are grouped by visit, with the age in days corresponding with each visit as follows: 01 m (25–46 days), 06 m (164–219 days), 12 m (351–429 days), 18 m (517–582 days), and 24 m (709–916 days).

