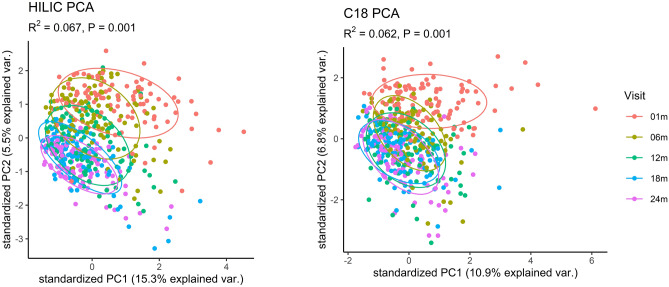
Figure 4.
Ordination plot of principal components 1 and 2 for confirmed metabolites detected in HILIC (left) and C18 (right) by infant age in days. R2- and P- values calculated using Permutational Multivariate Analysis of Variance, with age in days as the explanatory variable. Points are colored by visit, with the age in days corresponding with each visit as follows: 01 m (25–46 days), 06 m (164–219 days), 12 m (351–429 days), 18 m (517–582 days), and 24 m (709–916 days).

