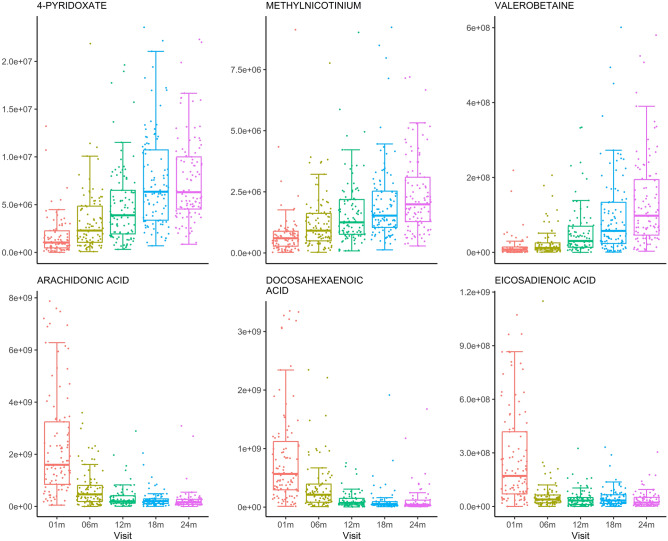
Figure 5.
Visual representation of the intensity of selected confirmed metabolites detected in the HILIC (top) and C18 (bottom) chromatography columns which varied most significantly with infant age. Observations are grouped by visit, with the age in days corresponding with each visit as follows: 01 m (25–46), 06 m (164–219), 12 m (351–429), 18 m (517–582), and 24 m (709–916). The metabolite labeled methylnicotinium was unidentified but was an accurate mass match for methylnicotinium.

