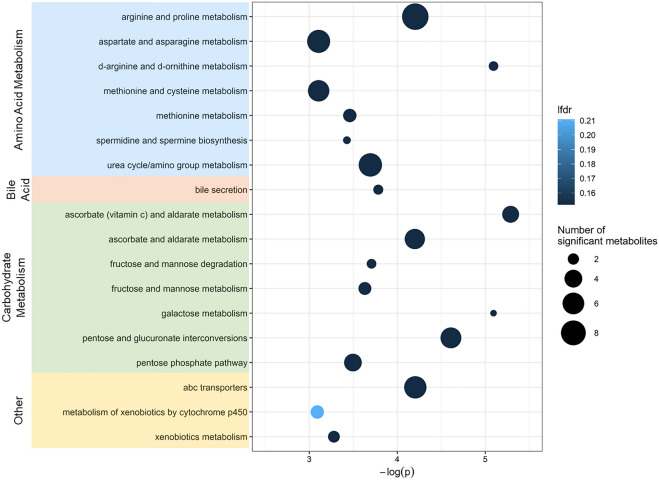
Figure 6.
Overview of enriched pathways by confirmed HILIC and C18 chromatography column metabolites that were significantly associated with infant age, identified using Metapone. Pathways with P ≥ 0.05 and weighted number of significant metabolites ≥ 1.5 are included. Point size indicates the number of significant metabolites identified within each pathway and point color indicates significance after adjustment for multiple testing via conditional local false discovery rate (lfdr). Pathways are grouped by super pathway (amino acid metabolism, bile acid, carbohydrate metabolism, lipid, and other), indicated by color.

