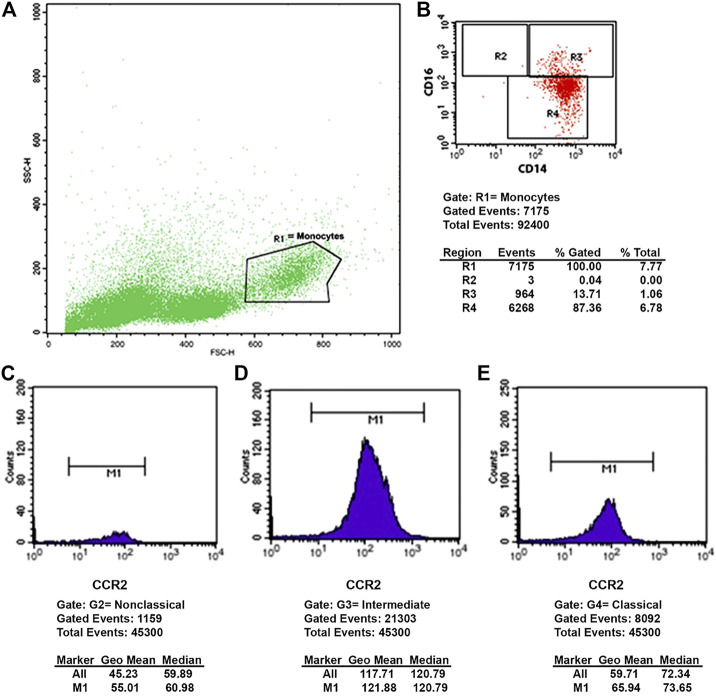
FIGURE 1.
Flow cytometry plot. (A) Size (FSC-H) and complexity (SSC-H) graph, showing the mononuclear cells and the monocyte gate (R1). (B) Fluorescence graph, showing: R2 non-classical (CD14+CD16++), R3 intermediate (CD14++CD16+) and R4 classical (CD14++CD16−) monocyte subtypes. (C–E) Histograms representing the expression of CCR2 in non-classical (C), intermediate (D) and classical (E) monocytes.

