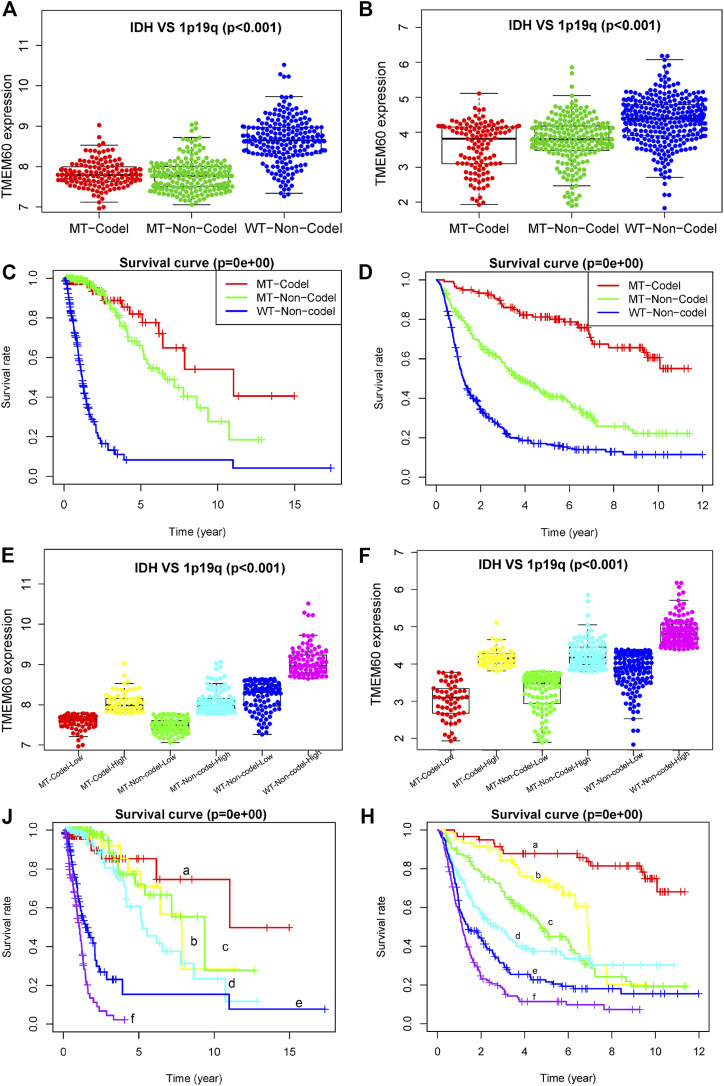
FIGURE 6.
Influence of TMEM60, 1p19q status, and IDH status on the survival time of glioma patients. Expression level of TMEM60 in different subgroups of 1p19q status and IDH status in (A) TCGA and (B) CGGA. Survival curves of glioma patients in different subgroups of 1p19q status and IDH status in (C) TCGA and (D) CGGA. Six subgroups according to TMEM60 expression, 1p19q status, and IDH status in (E) TCGA and (F) CGGA. Survival curves of glioma patients in different subgroups of (J) TCGA and (H) CGGA. a, IDH MT-1p19q codel-low TMEM60: IDH mutant and 1p19q codeletion and TMEM60 low expression; b, IDH MT-1p19q codel-high TMEM60: IDH mutant and 1p19q codeletion and TMEM60 high expression; c, IDH MT-1p19q non-codel-low TMEM60: IDH mutant and 1p19q non-codeletion and TMEM60 low expression; d, IDH MT-1p19q non-codel-high TMEM60: IDH mutant and 1p19q non-codeletion and TMEM60 high expression; e, IDH WT-1p19q non-codel-low TMEM60: IDH wildtype and 1p19q non-codeletion and TMEM60 low expression; f, IDH WT-1p19q non-codel-high TMEM60: IDH wildtype and 1p19q non-codeletion and TMEM60 high expression.

