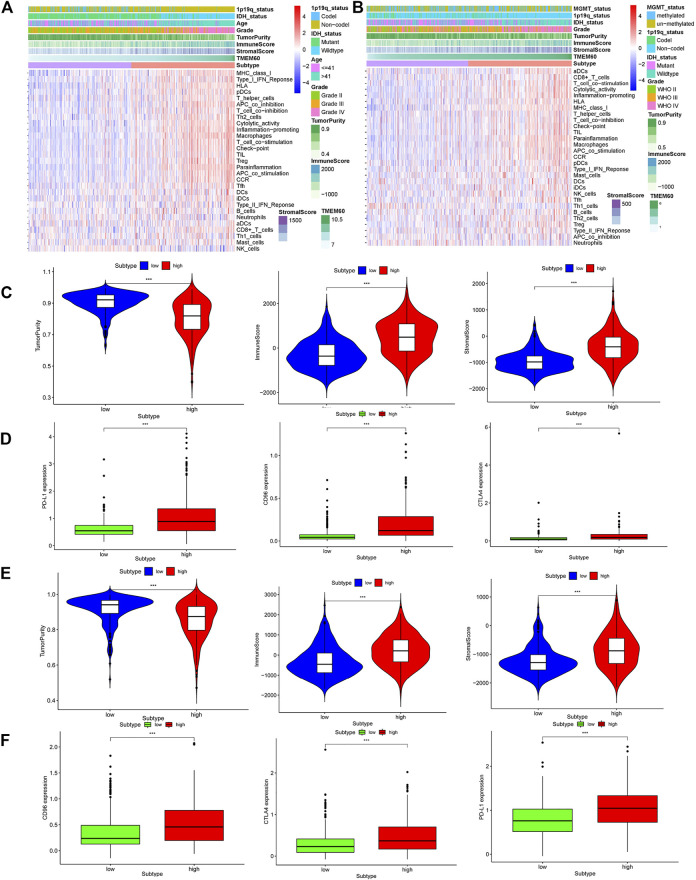
FIGURE 7.
Relationship between TMEM60 and tumor microenvironment. Immune microenvironment heatmaps related to TMEM60 expression in (A) TCGA and (B) CGGA. Correlation between microenvironment-related indicators and TMEM60 in (C) TCGA and (E) CGGA. Correlation between TMEM60 and tumor immune checkpoint expression (CD96, PD-L1, CTLA4) in (D) TCGA and (F) CGGA.

