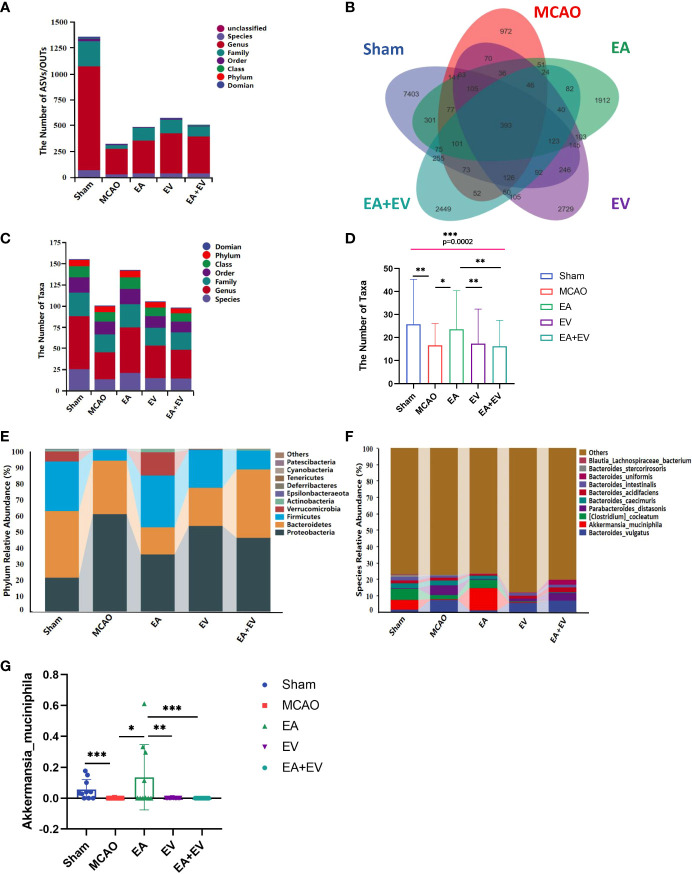
Figure 4.
EA and iPSC-EVs treatments modulated microbiota composition after cerebral ischemia−reperfusion. (A) The ASV/OTU number at each taxonomic level of phylum, class, order, family, genus, and species. The process used for species annotation involves comparing the data with a reference sequence database and scoring the results. (B) ASV/OTU Wayne diagram. To determine which species were common and which were unique among different samples (groups), ASV/OTU abundance tables were used to generate a Venn diagram. (C, D) Species composition taxon number statistics. (E, F) Taxonomic composition statistics at the phylum and species levels. (G) Akkermansia muciniphila flora abundance, n= 10/group, data wre expressed as the mean ± SD, *P < 0.05, **P < 0.01, and ***P < 0.001.

