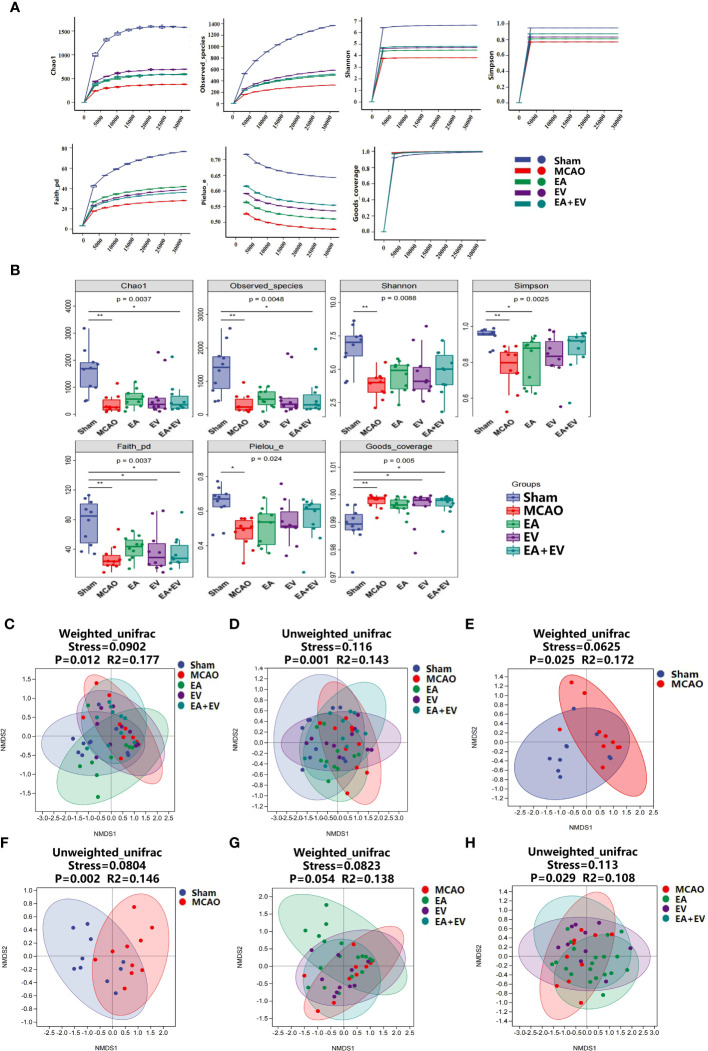
Figure 5.
EA and iPSC-EVs treatments regulated the microbiota alpha and beta diversity after cerebral ischemia−reperfusion. (A, B) Alpha diversity of microbial communities (Chao1, observed species index for richness; Shannon and Simpson index table characteristic diversity; Faith’s PD index represents diversity based on evolution. Pielou’s evenness index was used to characterize the evenness. Good’s coverage index represents the coverage). (C–H) Nonmetric multidimensional scaling analysis (NMDS) of beta diversity in microbial communities (weighted unifrac, unweighted unifrac). NMDS simplifies the data structure by reducing the dimension of the sample distance matrix to describe the distribution characteristics of samples at a specific distance scale. The lower the stress value of the NMDS, the better. The NMDS analysis results are more reliable when the stress value is less than 0.2, n = 10/group, data were expressed as the mean ± SD, *P < 0.05, **P < 0.01.

