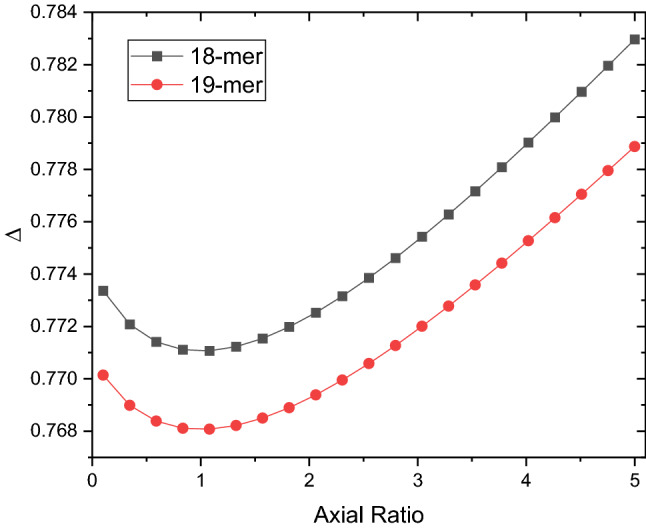
Figure 7.

Minimisation function performed by SingleHYDFIT on teicoplanin, using the above hydrodynamic parameters and molar mass consistent with either 18-mer (black square) or 19-mer (red circle). Both plots minimise to an axial ratio of 1.0.

Minimisation function performed by SingleHYDFIT on teicoplanin, using the above hydrodynamic parameters and molar mass consistent with either 18-mer (black square) or 19-mer (red circle). Both plots minimise to an axial ratio of 1.0.