
Figure 2.
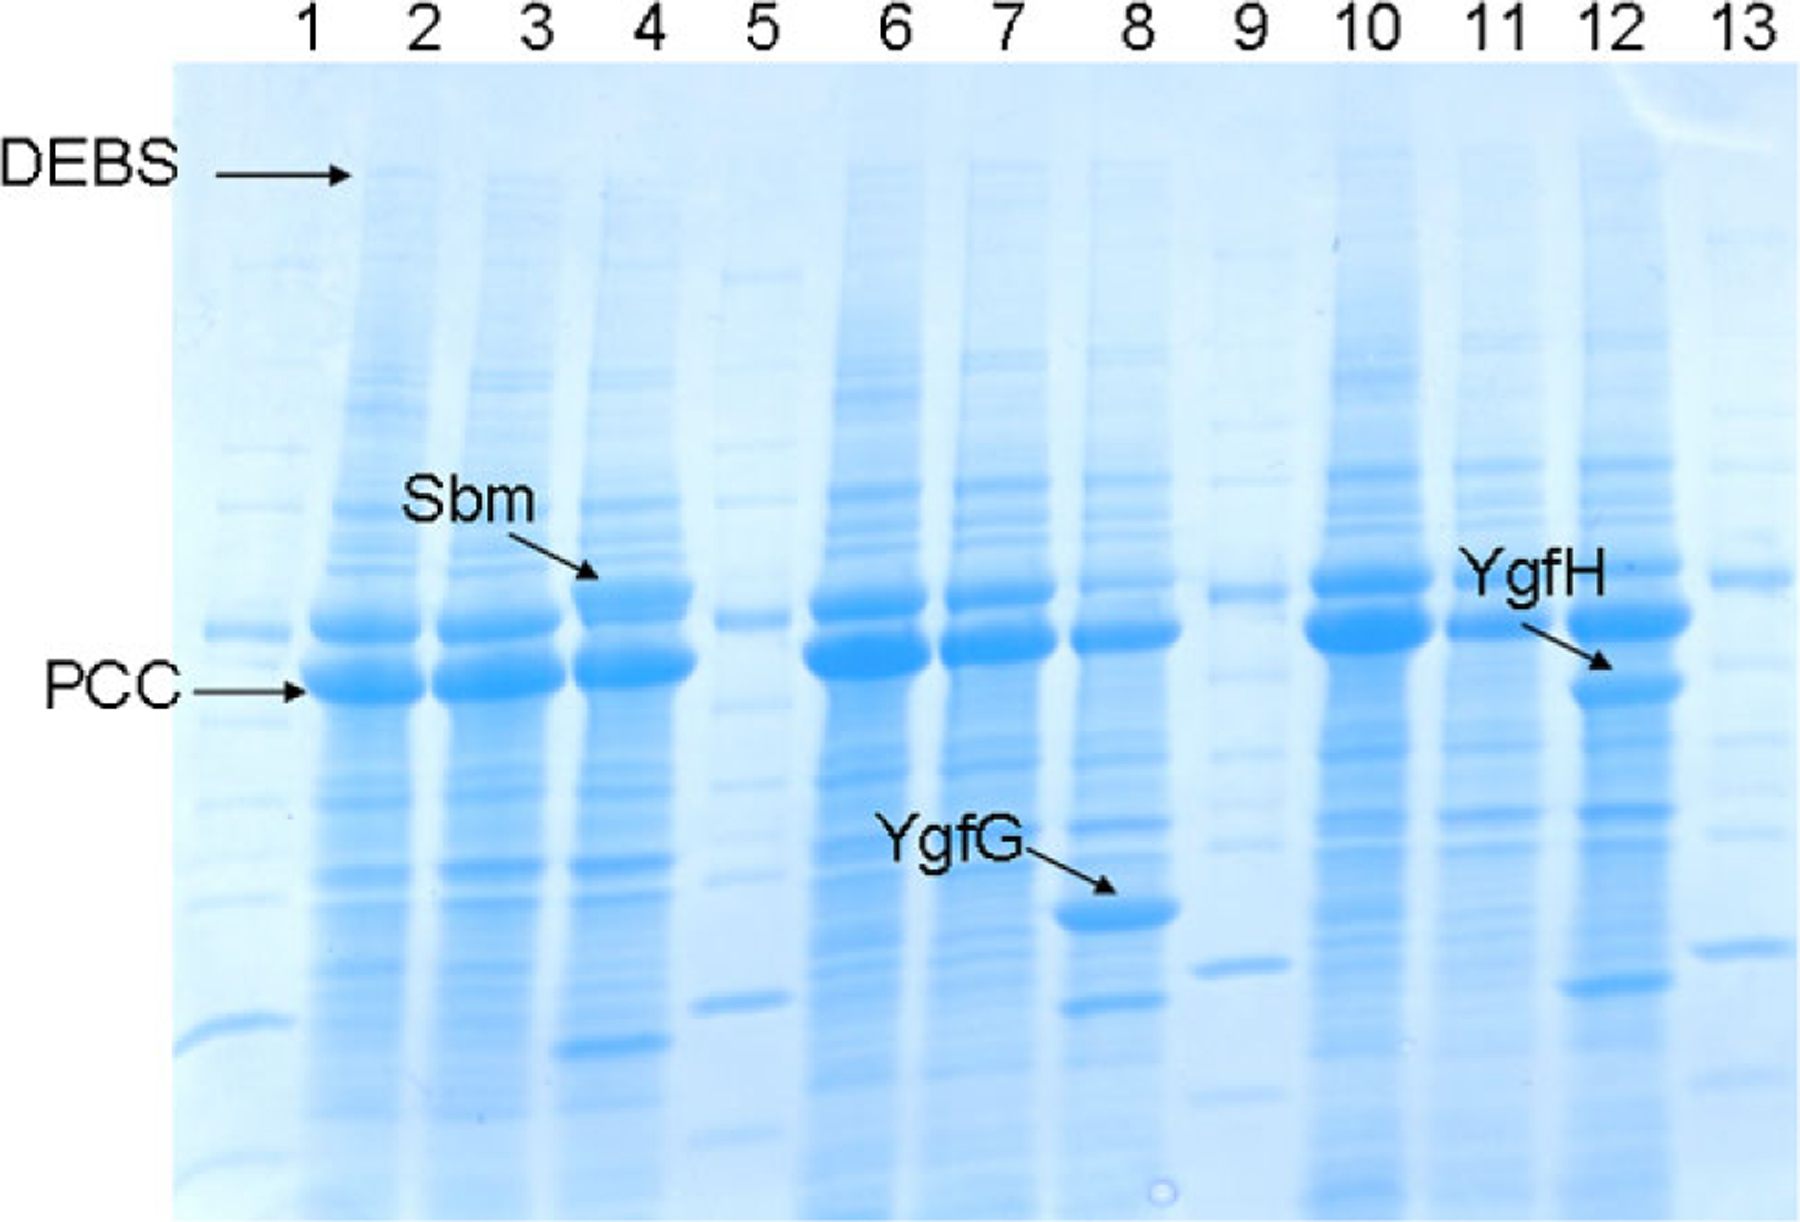
SDS–PAGE analysis of PCC, DEBS, sbm, ygfG, and ygfH over-expression. Lane 1: marker; lane 2: BAP1 (pBP130/pBP144); lane 3: TB1 (pBP130/pBP144); lane 4: BAP1 (pBP130/pBP144/pHZ1); lane 5: maker; lane 6: BAP1 (pBP130/pBP144); lane 7: TB2 (pBP130/pBP144); lane 8: BAP1 (pBP130/144/pHZ2); lane 9: marker; lane 10: BAP1 (pBP130/pBP144); lane 11: TB3 (pBP130/pBP144); lane 12: BAP1 (pBP130/144/ pHZ3); lane 13: marker.