
Figure 6.
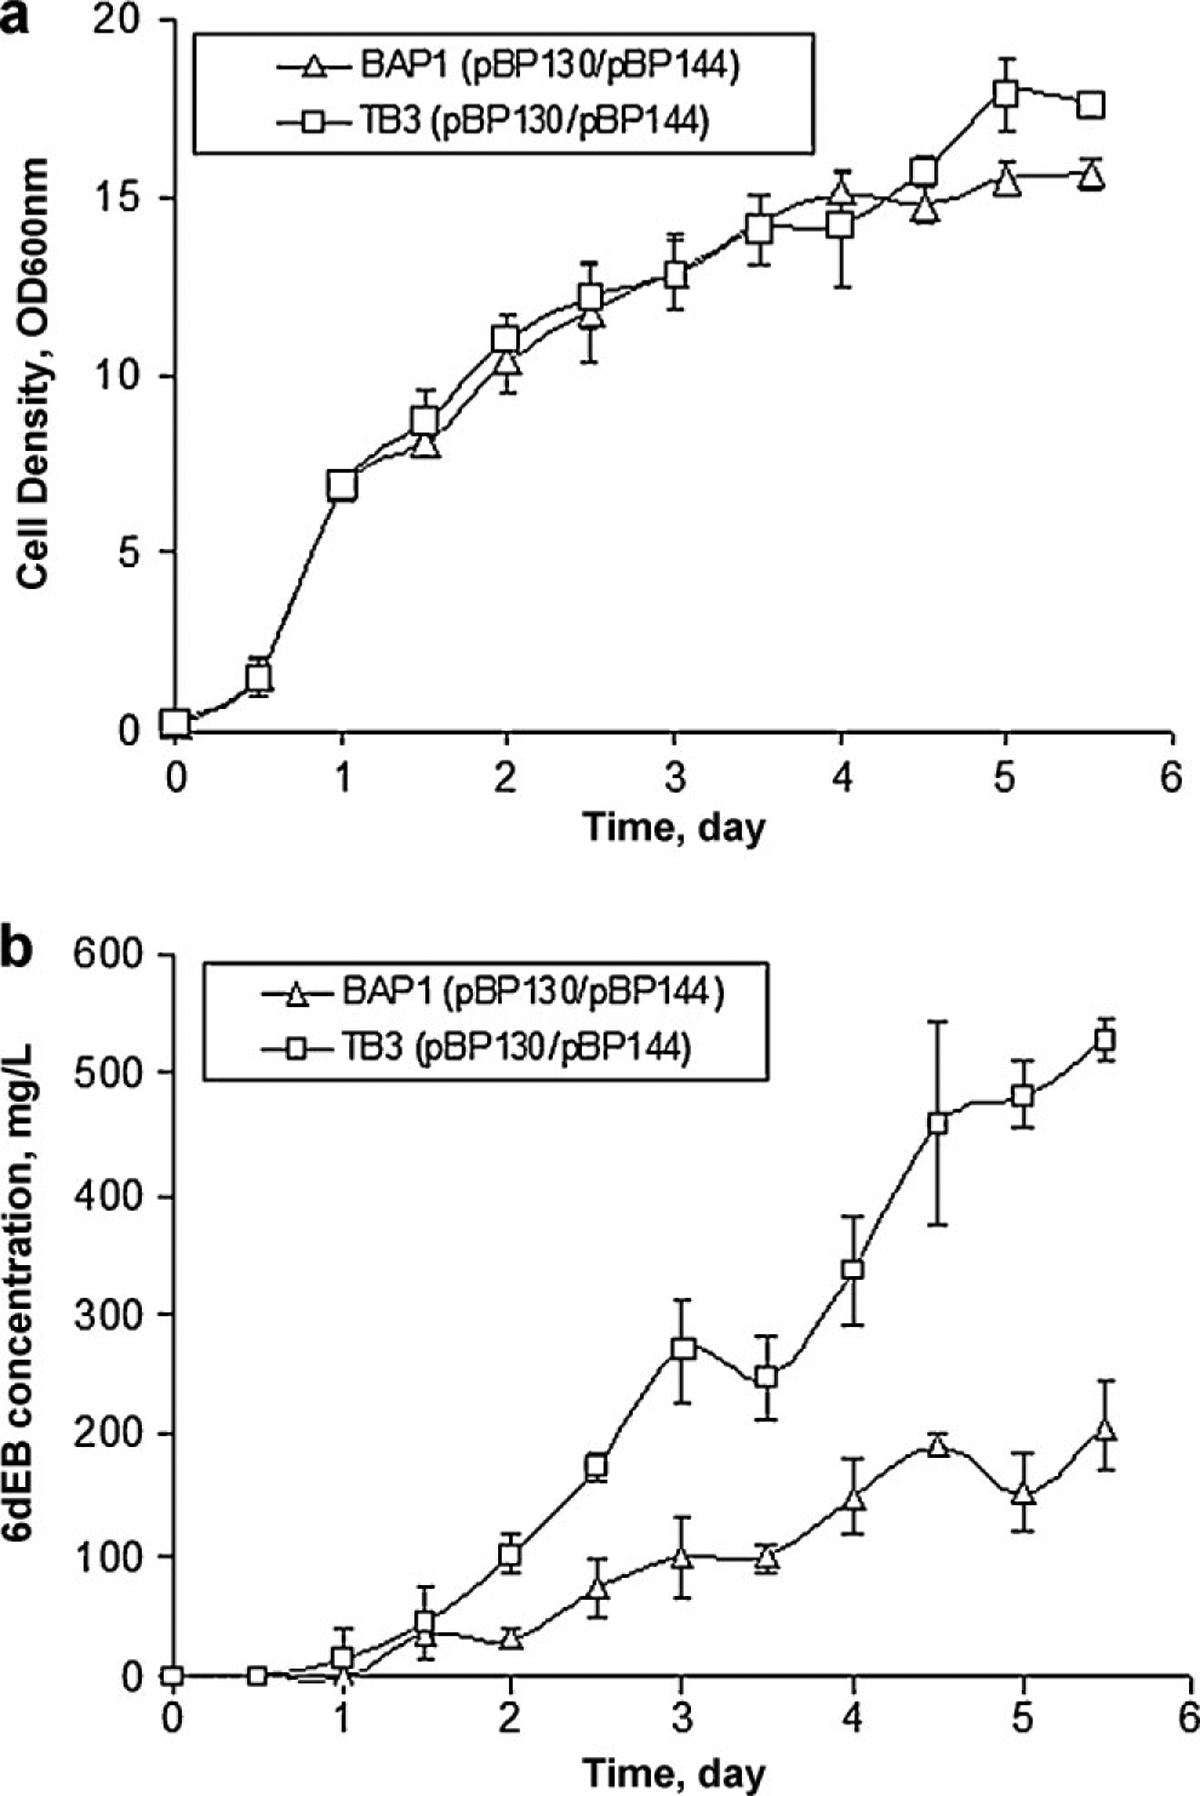
E. coli batch bioreactor comparison. a: Growth curves of BAP1 (pBP130/pBP144) and TB3 (pBP130/pBP144). b: 6dEB production levels of BAP1 (pBP130/pBP144) and TB3 (pBP130/pBP144).
Official websites use .gov
A
.gov website belongs to an official
government organization in the United States.
Secure .gov websites use HTTPS
A lock (
) or https:// means you've safely
connected to the .gov website. Share sensitive
information only on official, secure websites.
E. coli batch bioreactor comparison. a: Growth curves of BAP1 (pBP130/pBP144) and TB3 (pBP130/pBP144). b: 6dEB production levels of BAP1 (pBP130/pBP144) and TB3 (pBP130/pBP144).