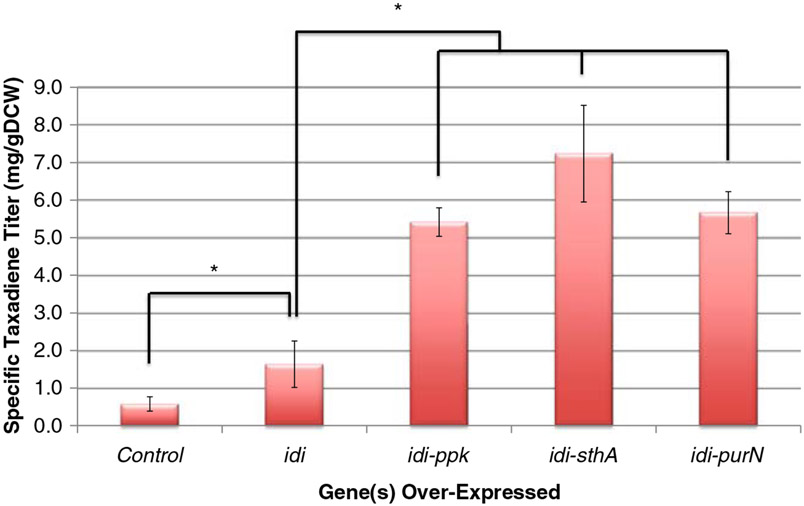
Fig. 6.
Experimental specific taxadiene titer data for the computationally identified targets combined with over-expression of idi. The “Control” sample is YW22 (pTrcHis2B-TXS-GGPPS). Error bars represent ± one standard deviation of three independent replicates. *Statistically significant (p<0.05, as determined by paired Student’s t-test) difference from the YW22 (pTrcHis2B-TXS-GGPPS) control

