Figure 1.
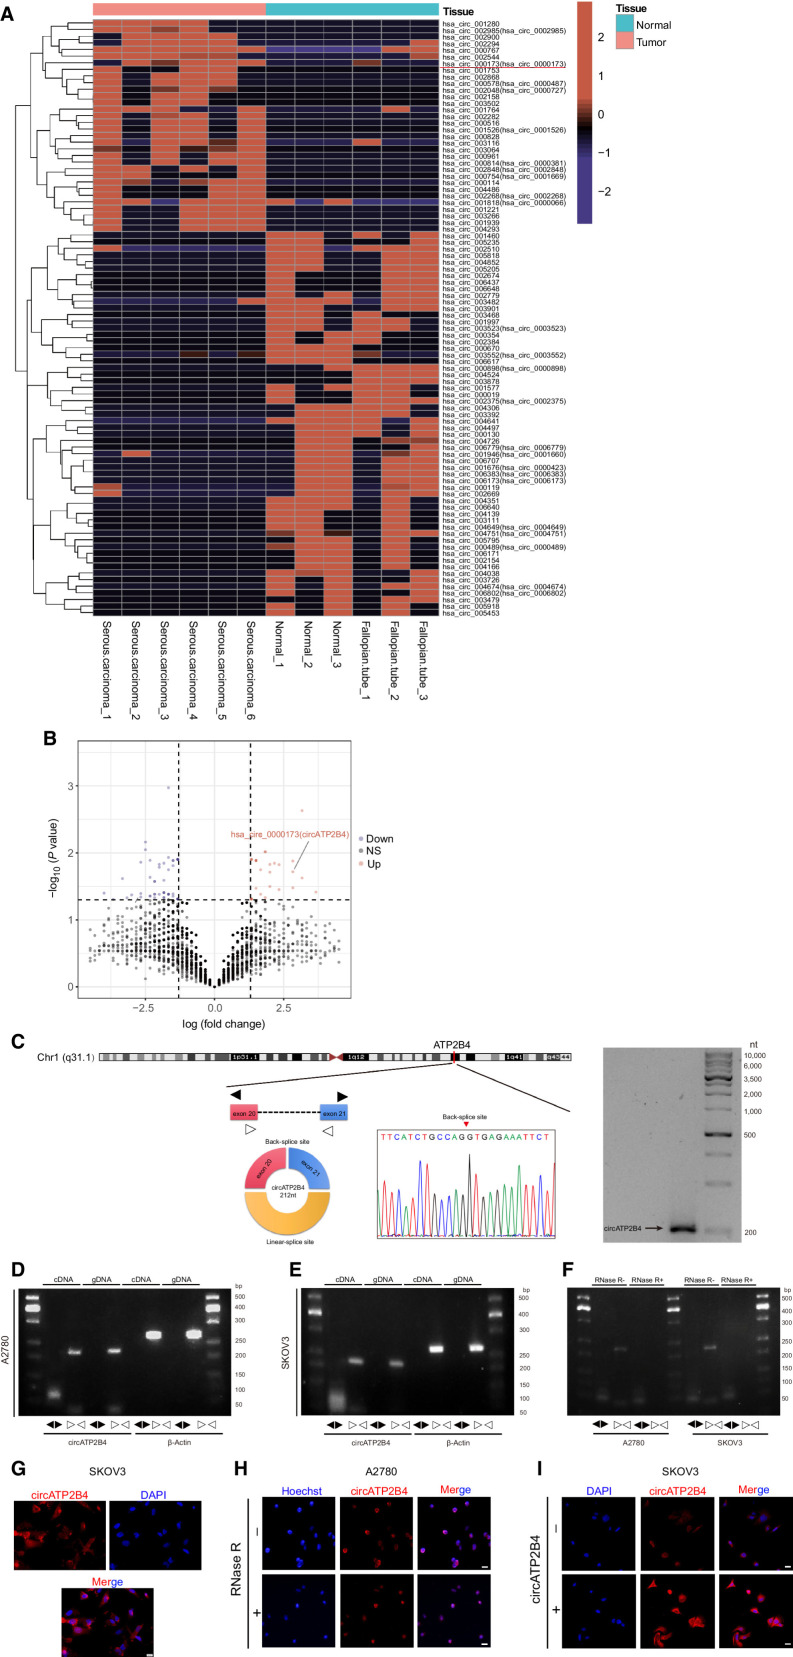
CircRNA expression profiles in EOC and characterization of circATP2B4. A, Hierarchical clustering of circRNA differential expression profiles between 6 EOC samples and 6 normal samples. The heat map was generated from differentially expressed circRNAs. B, Volcano map of deferentially expressed circRNAs. C, Schematic illustration of the genomic location and back splicing of circATP2B4 with the splicing site validated by Sanger sequencing and Northern blotting detection results of circATP2B4. D, Combining PCR with an electrophoresis assay indicated the presence of circATP2B4 using divergent and convergent primers from cDNA or genomic DNA (gDNA) in A2780 cells. E, Combining PCR with an electrophoresis assay indicated the presence of circATP2B4 using divergent and convergent primers from cDNA or gDNA in SKOV3 cells. F, The expression of circATP2B4 and ATP2B4 mRNA in both A2780 and SKOV3 cell lines was detected by PCR assay followed by nucleic acid electrophoresis in the presence or absence of RNase R. G, FISH analysis showed that circATP2B4 was mainly localized in the cytoplasm and a small part in the nucleus. Nucleus were stained blue with DAPI and cytoplasmic circATP2B4 was stained Cy3 (red). Scale bars, 20 μmol/L. H, RNA FISH analysis revealed the cellular localization of circATP2B4 in EOC cells when cells were treated with RNase R. Scale bars, 20 μmol/L. I, RNA FISH analysis revealed the expression of circATP2B4 in SKOV3 cells when cells were transfection of circATP2B4 plasmid. Scale bars, 20 μmol/L. The symbols * and ** show P < 0.05 and 0.01, respectively.

