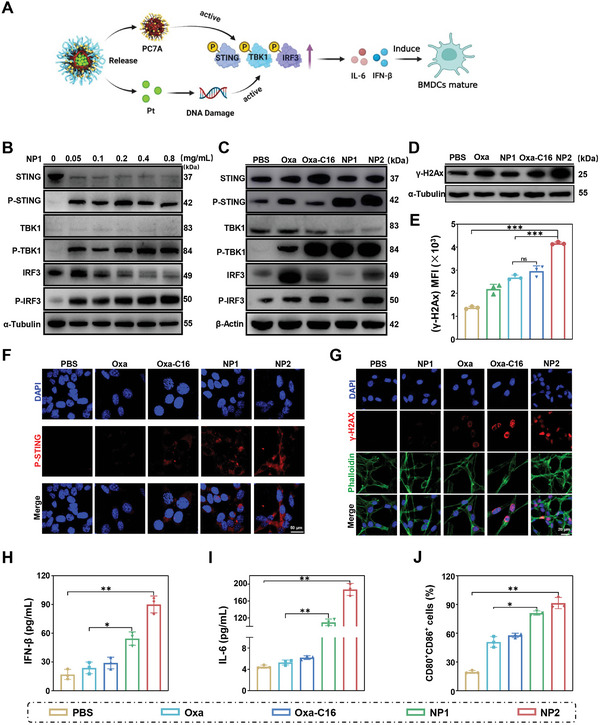
Figure 4.

Evaluation of the ability of Oxa, Oxa‐C16, NP1, or NP2 to intervene in CT26 cancer cells by the STING pathway for therapeutically enhanced combined chemotherapy and immunotherapy. A) Schematic illustration of the mechanism of action of NP2 to active the STING pathway. B) Change in the expression levels of STING pathway associated proteins upon concentration dependent treatment with NP1 determined by Western Blot analysis. C) Change in the expression levels of STING pathway associated proteins upon treatment determined by Western Blot analysis. D) Change in the expression levels of γ‐H2A upon treatment determined by Western Blot analysis. E) Comparison of the expression levels of γ‐H2A determined by flow cytometry. Data were obtained from Figure S6D, Supporting Information (n = 3 independent experiments). Data are means ± SD. ns = no statistical difference, *** p < 0.001 determined by ordinary one‐way ANOVA and Tukey post‐hoc tests. F) Immunofluorescence confocal laser scanning microscopy images of P‐STING upon treatment. Scale bar = 50 µm. G) Immunofluorescence confocal laser scanning microscopy images of γ‐H2AX upon treatment. Scale bar = 20 µm. H) Change of IFN‐β levels upon treatment determined by an ELISA assay (n = 3 independent experiments). I) Change of IL‐6 levels upon treatment determined by an ELISA assay (n = 3 independent experiments). J) Maturation of mouse bone marrow‐derived dendritic cells determined by flow cytometry. Data were obtained from Figure S6G, Supporting Information (n = 3 independent experiments). H–J) n = 3 independent experiments. Data are means ± SD. * p < 0.05, ** p < 0.01 determined by ordinary one‐way ANOVA and Tukey post‐hoc tests.
