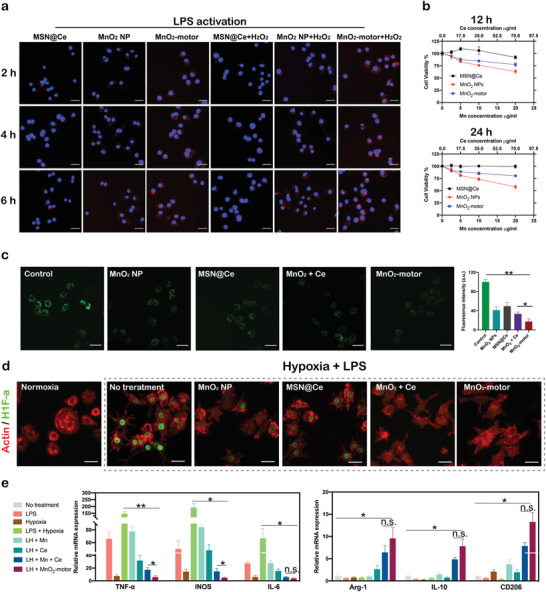
Figure 4.

In vitro evaluation of MnO2‐motors. a) Intracellular uptake of MnO2‐motors with or without H2O2 for 2, 4, and 6 h. Scale bar = 50 µm. b) Cell viability as determined by CCK‐8 assays after incubation with MnO2 NPs, MSN@Ce, and MnO2‐motors at various concentrations for 12 or 24 h (n = 4; mean ± SD). c) Inverted fluorescence microscopy images and corresponding fluorescence intensity of intracellular H2O2 in RAW264.7 cells incubated with MnO2 NPs, MSN@Ce, MnO2 + Ce, and MnO2‐motors in the presence of H2O2. Data represent mean ± SD (n = 4). Scale bar = 50 µm. d) HIF‐1α staining of RAW 264.7 cells pretreated with MnO2 NPs, MSN@Ce, MnO2 + Ce, and MnO2‐motors for 2 h and subsequently incubated for 8 h under hypoxic and inflammatory conditions. Scale bar = 50 µm. e) mRNA expression of M1 and M2 macrophage markers in RAW264.7 cells under various conditions, as evaluated by qRT‐PCR analysis. Data represent mean ± SD (n = 3). In (c,e), data analyzed using one way ANOVA test. (*p < 0.05, ** p < 0.01)
