
Figure 6.
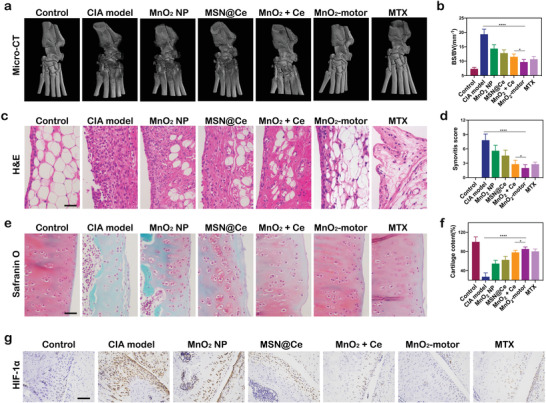
In vivo assessments of pathological features of CIA rat models. a) Representative Micro‐CT images of joint at day 29 after different treatments. b) Ratio between bone surface and bone volume. Data represent mean ± SD (n = 3). c) Hematoxylin and eosin (H&E) staining of synovium. Scale bar = 100 µm. d) Synovitis score. Data represent mean ± SD (n = 5). e) Safranin‐O staining of cartilage of CIA joints. Scale bar = 100 µm. f) Cartilage content. Data represent mean ± SD (n = 5). g) Immunohistochemical evaluation of HIF‐1α on knee sections. (n = 5). Scale bar = 200 µm. In (b,d,e), data analyzed using one‐way ANOVA test. (*p < 0.05, **p < 0.01)