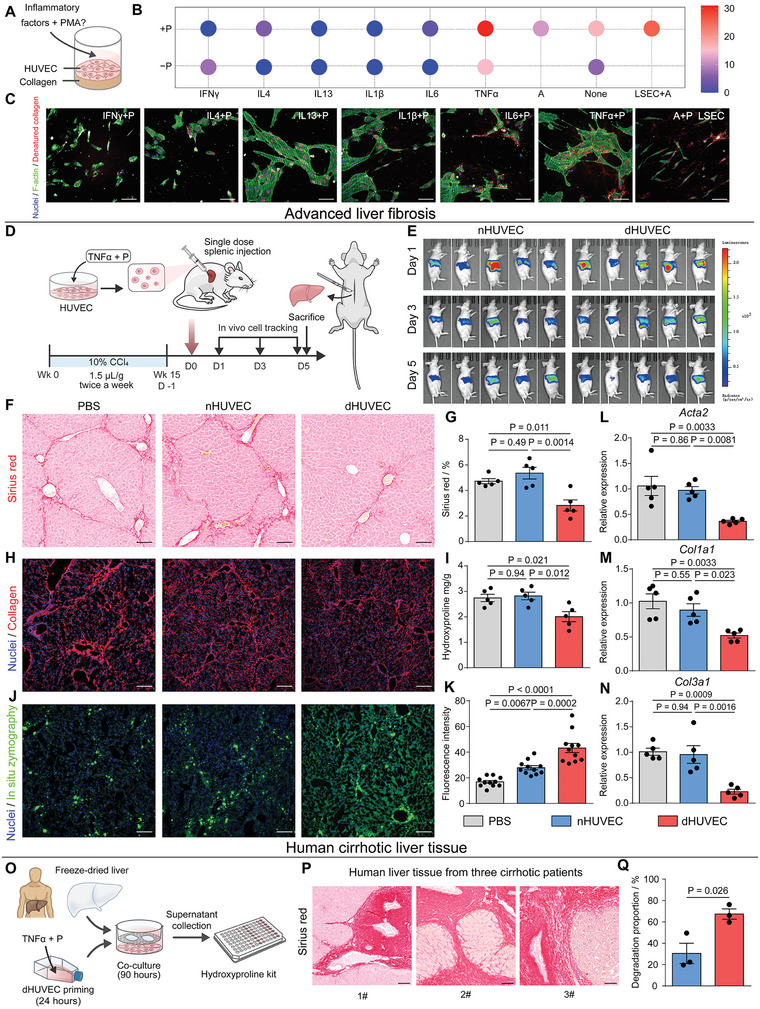
Figure 7.

dHUVECs could alleviate the progression of advanced mouse liver fibrosis and degrade scar‐rich clinical samples from liver cirrhotic patients ex vivo. A) Schematic of constructing and characterizing ECM‐degrading HUVECs (i.e., dHUVECs) B) Collagen degradation ability of HUVECs with different stimulation strategies characterized by CEDSS. C) Representative high‐content fluorescent images showing the HUVEC‐mediated collagen degradation stained by CHP assay. Nuclei (blue), F‐actin (green), denatured collagen (red). Scale bars, 100 µm. D) Schematic of one‐dose intrasplenic administration of dHUVECs to treat the mice with advanced liver fibrosis induced by CCl4. E) Bioluminescent imaging of nHUVECs and dHUVECs resided in mice at day 1, 3, and 5 post injection F and G) Representative Sirius Red staining images and statistical analysis of collagen deposition in liver tissues treated by PBS, nHUVECs, and dHUVECs (n = 5, biological independent mice per group). Scale bars, 100 µm. H) Representative immunofluorescent images of collagen staining in liver tissues treated by PBS, nHUVECs, and dHUVECs. Scale bars, 100 µm. I) Quantification of hepatic hydroxyproline content. The data are expressed as hydroxyproline (mg) per liver dry weight (g) (n = 5, biologically independent mice per group). J and K) Representative images and statistical analysis of MMPs stained by in situ zymography in liver tissues treated by PBS, nHUVECs and dHUVECs (n = 11, points of detection derived from at least 3 biologically independent mice). Scale bars, 100 µm. L to N) Relative mRNA expression of Acta2, Col1a1, and Col3a1 in liver tissues treated by PBS, nHUVECs and dHUVECs (n = 5, biologically independent mice per group). O) Schematic of characterizing the dHUVECs‐mediated degradation of scar‐rich clinical samples from liver cirrhotic patients ex vivo. P) Representative Sirius Red staining images of clinical liver samples from 3 patients with liver cirrhosis. Scale bars, 100 µm. Q) Statistical analysis of the dHUVECs‐mediated degradation of scar‐rich samples (n = 3, biological independent samples derived from 3 patients with liver cirrhosis). The statistical analysis in (Q) was performed using two‐tailed unpaired t‐test. The statistical analysis in (G, I, K–N) was performed using a one‐way ANOVA with Turkey test. Results are presented as means ± SEM.
