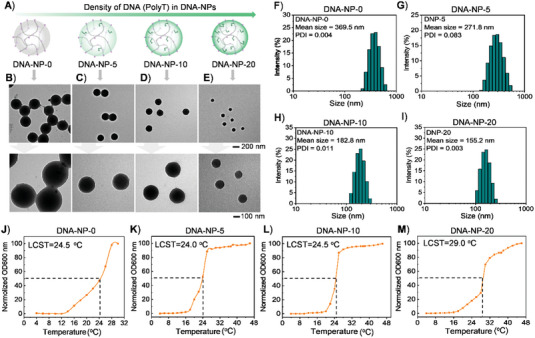
Figure 1.

A) Schematic illustration of DNA‐NPs with various densities of poly T side chains, which were denoted as DNA‐NP‐0, DNA‐NP‐5, DNA‐NP‐10, and DNA‐NP‐20, respectively. B–E) The TEM images of DNA‐NP‐0, DNA‐NP‐5, DNA‐NP‐10, and DNA‐NP‐20 with different magnifications. F–I) Hydrodynamic diameter distributions of DNA‐NP‐0, DNA‐NP‐5, DNA‐NP‐10, and DNA‐NP‐20 depending on DLS analysis. J–M) Cyclic turbidity curves of DNA‐NP‐0, DNA‐NP‐5, DNA‐NP‐10, and DNA‐NP‐20.
