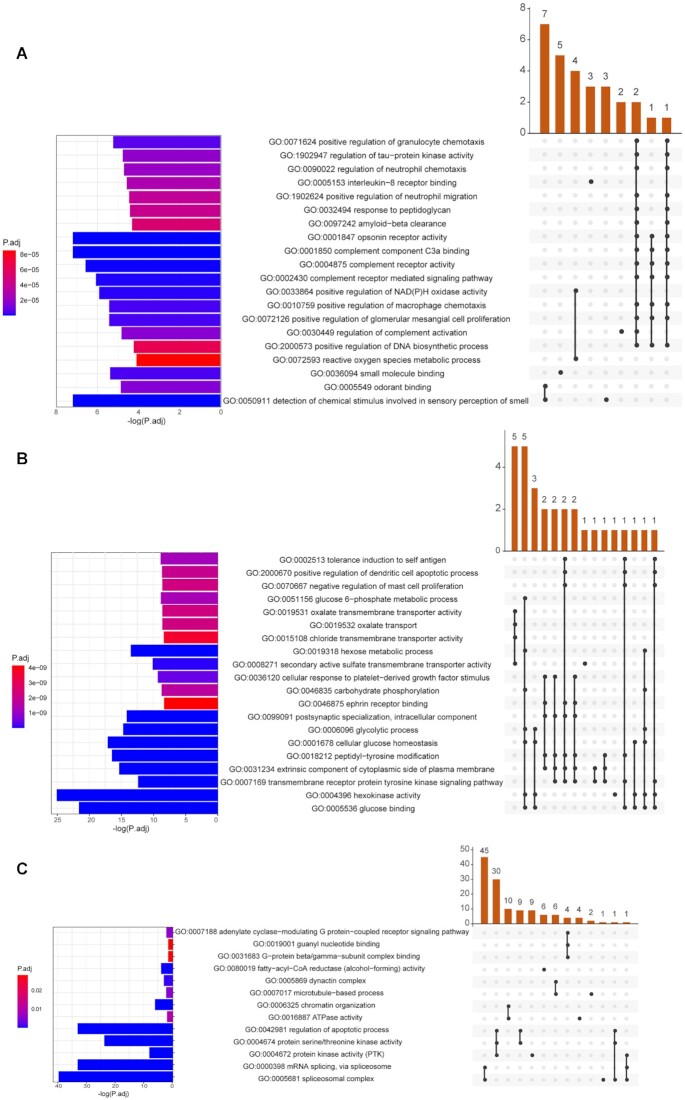
Figure 4:
GO enrichment analysis of gene families. (A) Expanded and (B) contracted gene families from Anatidae varieties (duck, Zhedong white goose, Lion-head goose). (C) Unique gene families from the Lion-head goose. The bar graph on the left represents the P-adjust gradient of GO terms, and the color corresponds to the number on the x-axis (i.e., −log (P.adj)). The bluer the color is, the smaller the P-adjust is, and the more significant it is. The redder the color is, the larger the P-adjust is, and the less significant it is. The upper right bar chart exhibits that several genes act together on the terms below. The lower right chart displays the intersection of the genes of each term; the dots connected by lines represent the intersection of multiple terms; the black dots represent “yes,” and the gray dots represent “no.”

