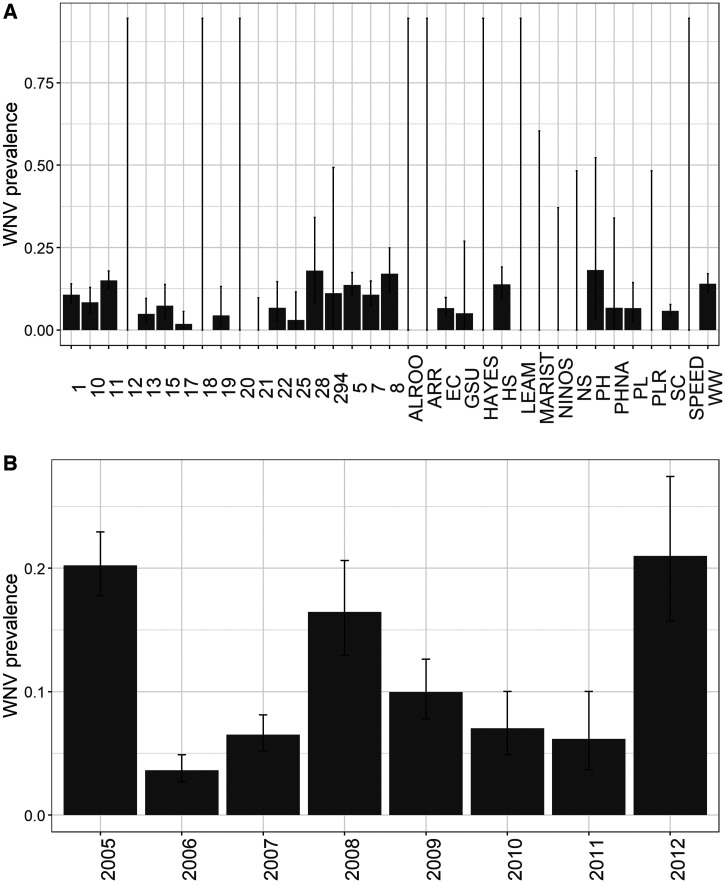
Figure 4.
(A) Estimated WNV seroprevalence in birds by location in Chicago, Illinois, 2005–2012. (B) Estimated WNV seroprevalence in birds by year in Chicago, Illinois, 2005–2012. Bars represent the estimate; lines represent the 95% CI of the estimate. Sampling location maps and descriptions can be found in the referenced Chicago-specific studies (see Background).

