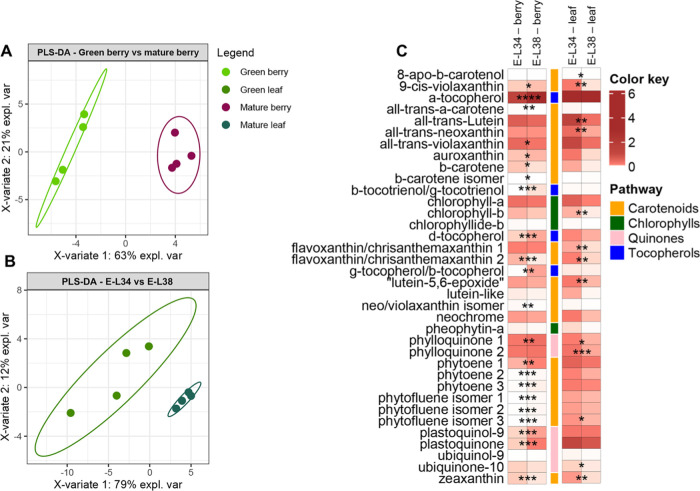
Figure 2.
Changes in targeted isoprenoids from purified plastids from green leaf and berry skin of red grapes cv. “Vinhão”: supervised partial least squares-discriminant analysis (PLS-DA) of (A) green berry vs mature berry, (B) green leaf vs mature leaf, and (C) heatmap of the observed changes. Variables in the PLS-DA score plot were colored according to the tissue and developmental stage. Data represent, for each metabolite, the fold on the internal standard (IS, a-tocopherol acetate) level/gm DW. Asterisks indicate statistical significance between mature (E-L 38) and green (E-L 34) conditions following the Student’s t-test: *P ≤ 0.05; **P ≤ 0.01; ***P ≤ 0.001; and ****P ≤ 0.0001.

