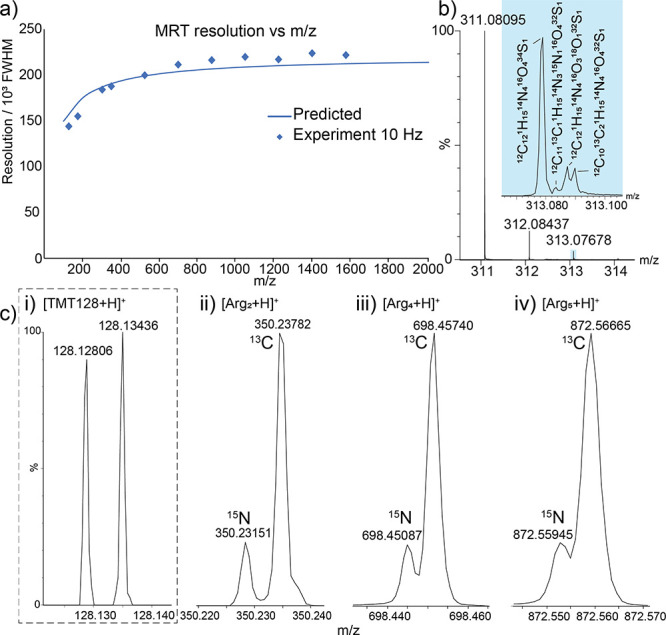
Figure 4.

Characterizing resolving power. (a) The MRT analyzer exhibits resolving powers of greater than 200 000 (fwhm). (b) An LC-mass spectrum of sulfadimethoxine showing the fine isotope structure of the A+2 signal. (c) The MRT analyzer can distinguish the 6.3 mDa difference between the fine isotope signals of 13C and 15N up to approximately 900 m/z as shown here for clusters of arginine.
