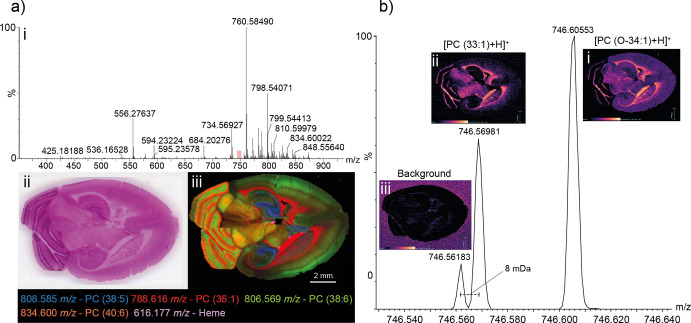
Figure 6.
DESI-MSI analysis of murine brain. (a) A representative DESI mass spectrum (i) obtained as part of an MSI experiment on the murine brain. The lipid envelope is observed between 700 and 900 m/z. The murine brain section, shown as an H and E stained optical image (ii) was imaged in its entirety. A selection of identified species is shown in an overlaid molecular image (iii). Signals correspond to putative identifications of PC (38:5) (808.58542 m/z, blue, 420 ppb), PC (36:1) (788.61609 m/z, red, −370 ppb), PC (38:6) (806.56909 m/z, green, −423 ppb), PC (40:6) (834.60034 m/z, coral, 469 ppb), and Heme (616.17682 m/z, violet, 101 ppb). (b) Demonstration of the power of the high resolution MRT for imaging. A lipid signal corresponding to PC (33:1) is well-resolved from nearby lipid species but also from interfering background. On a lower resolution system, the background would interfere with the PC (33:1) signal yielding a composite image.

