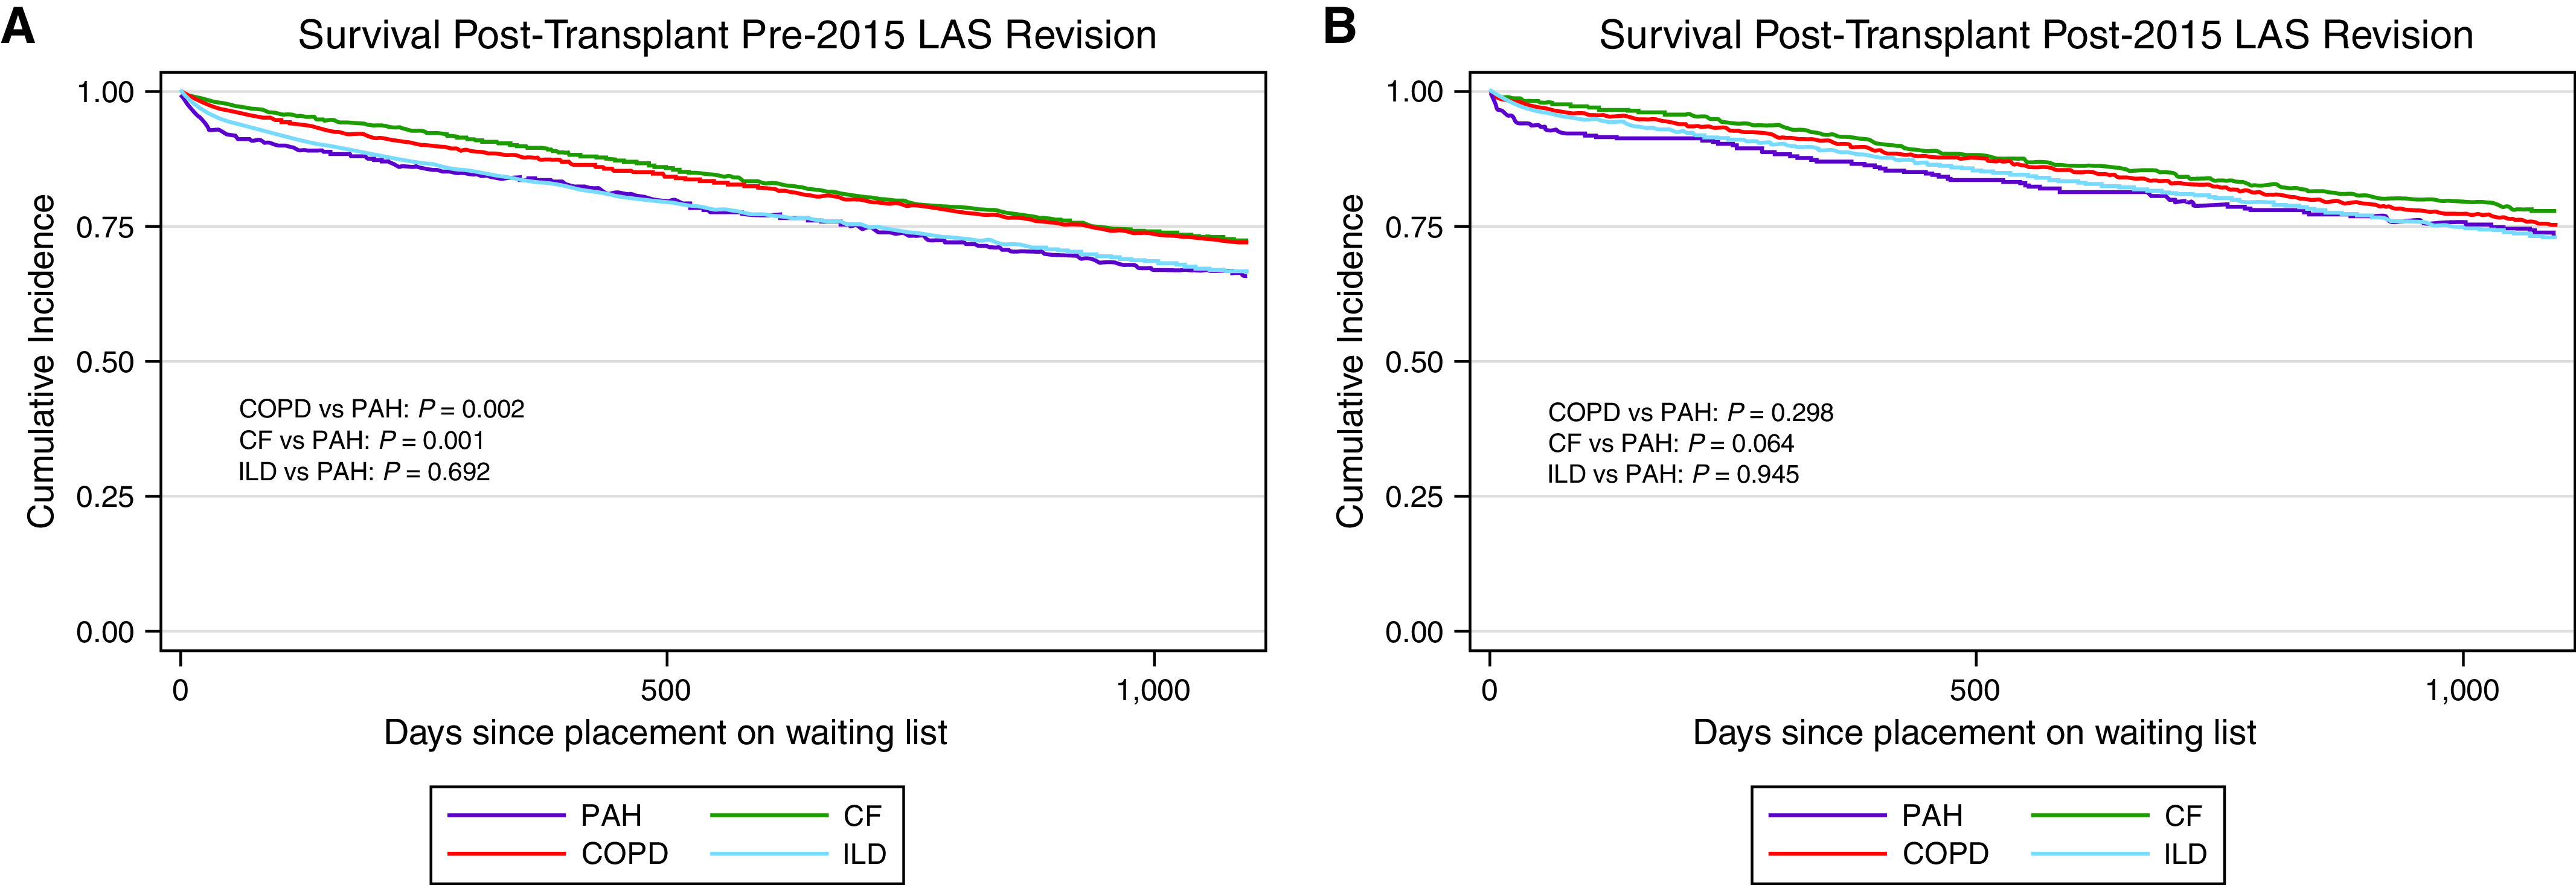
Figure 4.

Kaplan-Meier plot of post-transplant survival (A) before the 2015 lung allocation score (LAS) revision stratified by LAS category, and (B) after the 2015 LAS revision stratified by LAS category. Purple lines denote LAS category B–PAH. Red lines indicate LAS category A–COPD. Green lines indicate LAS category C–CF. Blue lines indicate LAS category D–ILD. Log-rank test performed to assess for statistical significance. For definition of abbreviations, see Figure 1.
