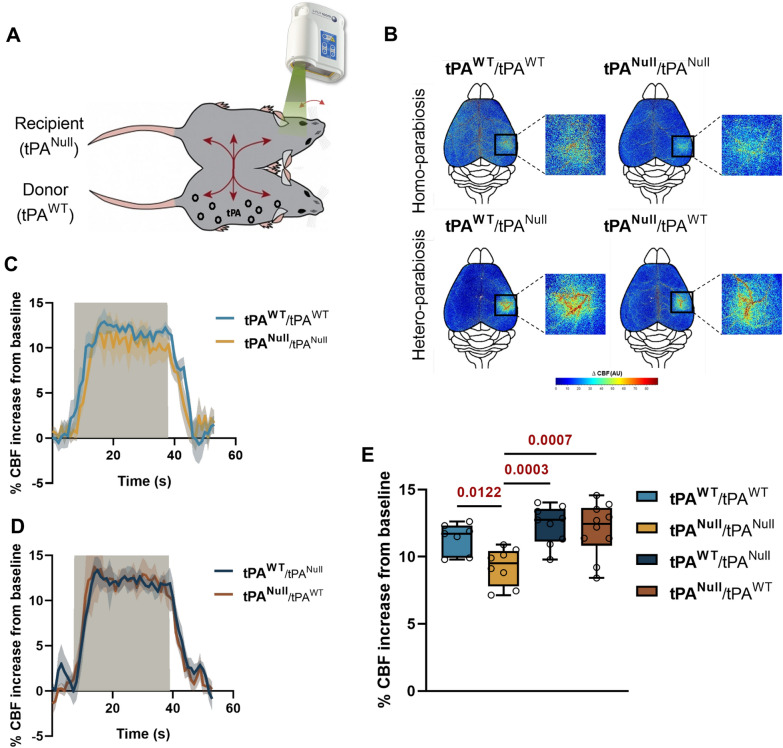
Fig. 2.
Endogenous tPA levels influence NVC. A Schematic representation of the procedure of whisker stimulations paradigm between two mice (tPANull and tPAWT) in parabiosis. tPA from the donor (tPAWT) will be share to the recipient (tPANull). B Colormap corresponds to the activation map related ∆CBF changes during whisker stimulations in parabiont tPANull or tPAWT mice. Warm colours indicate an elevation of CBF during whisker stimulations. C, D Time course of % CBF increase (mean ± SEM) during whisker stimulations ( ) in homo-parabiosis tPAWT (
 ) and tPANull (
 ) mice (C) and hetero-parabiosis tPAWT (
 ) and tPANull (
 ) mice (D). E Box plots show the variation of % CBF increase from baseline during whisker stimulations in homo-parabiosis tPAWT/tPAWT and tPANull/tPANull, and hetero-parabiosis tPAWT/tPANull and tPANull/tPAWT (the stimulated mouse is mentioned in bold). Box plots with medians, 1st and 3rd quartiles, min and max with values for each mouse. *p < 0.05 and from tPANull/tPANull, one-way ANOVA and Uncorrected Fisher’s LSD tests, n = 7 tPAWT/tPAWT, n = 8 tPANull/tPANull, n = 9 tPAWT/tPANull, n = 10 tPANull/tPAWT (n represents the number of stimulated animals)

