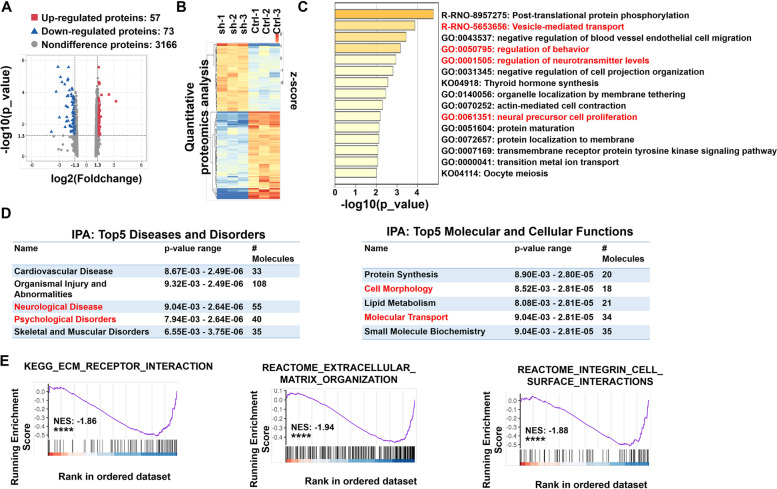
Fig. 4.
Functional enrichment analysis of proteomic results. A Volcano plot of all 3296 identified proteins quantified by proteomic analysis. B Heatmap was plotted based on the levels of the differentially expressed proteins. The color intensity indicates the expressional protein level as displayed: red, highest; green, lowest. C Biological pathway analysis of differently expressed proteins was performed in Metascape. The top 15 significantly enriched terms were displayed. Color-coded P-values indicate the significance of the enrichment for each bin as indicated. Our experiment observed abnormal behaviors and impairment in neurite outgrowth in Sh-NRXN1 rats. Combined with the reported correlation of NRXN1 on neurotransmitter release, the features we focus on are highlighted in red. D The proteomic result was uploaded into ingenuity pathway analysis (IPA). Top-ranked significantly enriched disease and disorder (left) and molecular and cellular (right) pathways in the IPA reference database were listed. E The importance of the downregulated protein-coding gene was assessed using a GSEA approach. The position of subjected genes in the ranked list was represented by black bars, and the purple curve represents the running enrichment score (ES). The normalized enrichment score (NES) is the primary statistic for assessing gene set enrichment results. GSEA revealed a significant enrichment of ECM_RECEPTOR_INTERACTION (left), EXTRACELLULAR_M-ATRIX_ORGANIZATION (middle), and INTEGRIN_CELL_SURFACE_INTERA-CTIONS (right), ****P < 0.0001

