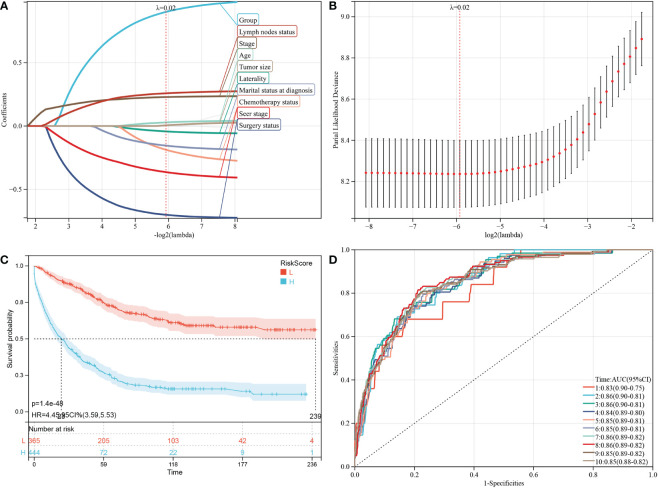
Figure 5.
Construction and evaluation of CSS associated predictive models. (A, B) are the LASSO coefficient profiles and LASSO deviance profiles, respectively, which show the optimal λ value and risk factors. (C) KM survival curves of CSS according to the risk score perform that prognosis of low-risk group is significantly better than high-risk score group. (D) ROC curves of CSS at 1-10 years according to the risk score in the predictive model data sets.

