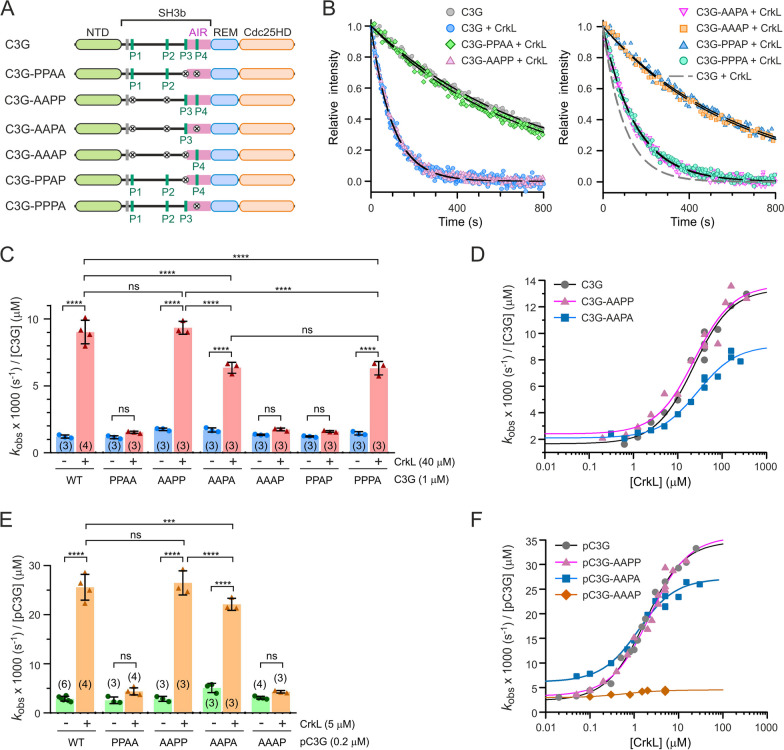
Fig. 3.
Contribution of individual PRMs to the activation of C3G by CrkL. A Schematic representation of the PRM mutants used to study the activation of C3G by CrkL. B Representative exchange reactions of Rap1:mant-dGDP (200 nM) catalyzed by C3G wild type and mutants (1 µM) in the presence of CrkL (40 µM). Lines are the single exponential decay models fitted to obtain the kobs. C Nucleotide exchange rates of C3G wild type and mutants (1 µM) alone and in the presence of 40 µM CrkL. Data are shown as scatter plots with bars, means ± standard deviation. The number of independent measurements is indicated in parentheses. Statistical comparison was analyzed using ANOVA followed by Tukey’s multiple comparisons test; ***P < 0.001, ****P < 0.0001, ns P > 0.05. D Dose-dependent effect of CrkL on the GEF activity of C3G (1 µM) wild type and two mutants. Lines are the fitted sigmoidal models. E Nucleotide exchange rates of Src-phosphorylated C3G (pC3G, 0.2 µM) wild type and mutants, alone and in the presence of 5 µM CrkL. Statistical comparisons were done as in (C). F Dose-dependent effect of CrkL on the GEF activity of pC3G (0.2 µM) wild type and mutants. Dissociation rate constants in (C)–(F) are referred to 1 µM C3G for comparison

