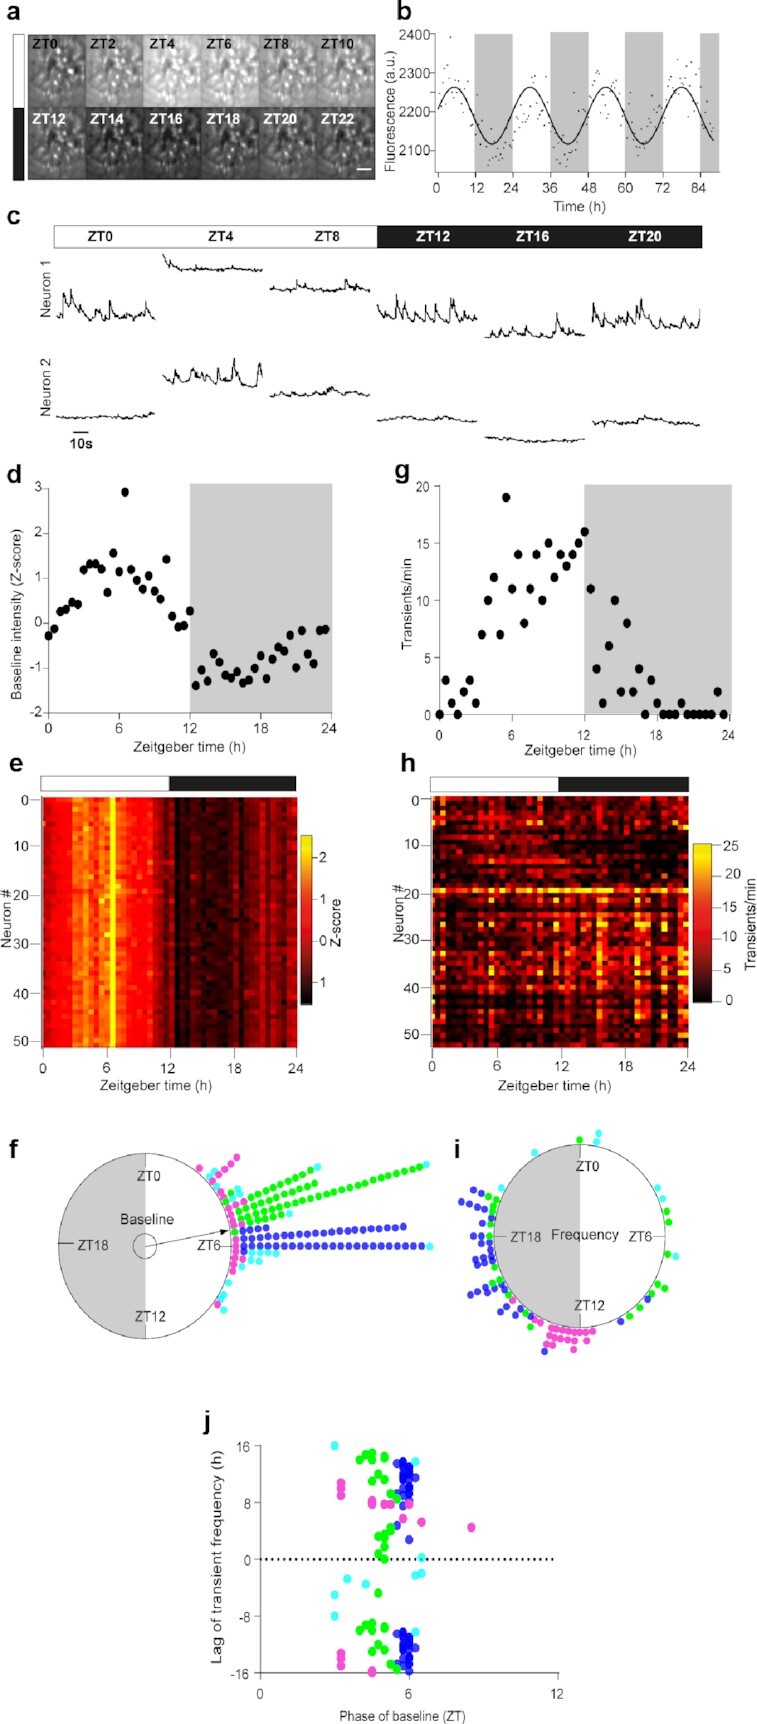
Fig. 1.

Daily diversity and unity of two Ca2+i dynamics in individual SCN neurons in vivo. (a) Time-lapse projection of GCamp6f fluorescence monitored every 2 hours from zeitgeber time ZT = 0 to ZT = 22, through a GRIN lens aimed at the SCN of a freely moving mouse. Scale bar, 100 µm. (b) Daily variations in global GCamp6f signal intensity from one representative SCN field of view. The solid line represents the best cosine fit of experimental data points, measured every 30 minutes over four consecutive day–night cycles. (c) Longitudinal 1-minute recordings of GCamp6f fluorescence over 1 day–night cycle, from two SCN neurons within the same field of view. (d)–(i) Daily variation in GCamp6f baseline (d)–(f) and spike frequency (g)–(i), in SCN neurons. Example from one representative neuron (d) and (g), heat maps obtained from 52 neurons recorded in the same SCN field of view (e) and (h), and Rayleigh plots of significant individual daily peak phases measured from four different mice (f) and (i). Each color represents neurons from one mouse, examples were selected from the mouse color-coded in green. The inner circle represents the statistical threshold (P < 0.05) for the mean vector of the circular distribution of the aggregate data. The white and black boxes depict the light and dark phase, respectively. (j) Phase–lag relationship between spike frequency and the GCamp6f baseline.
