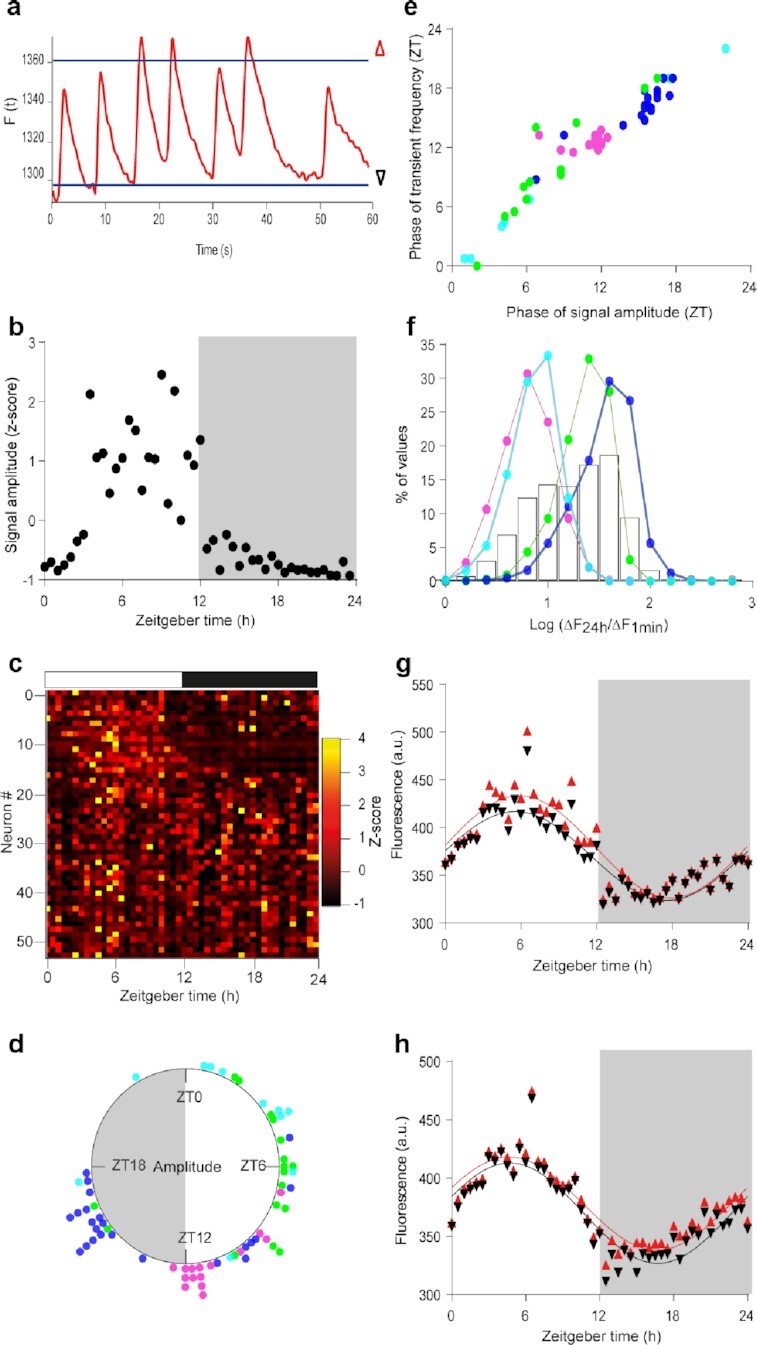
Fig. 2.

Small Ca2+i spikes built upon large daily changes in basal Ca2+i levels. (a) 1-minute recording of GCamp6f fluorescence, with thresholds for the 5th and 95th percentiles (baseline and topline, black and red triangles, respectively) used to calculate the signal amplitude. (b)–(d) Daily variations in GCamp6f signal amplitude in the same neuron (b) and same SCN field (c) as in Fig. 1. (d) Rayleigh plot of significant individual daily peak phases in signal amplitude for the aggregate data. (e) Phase relationship between spike frequency and signal amplitude. (f) Distribution of the ratio values calculated, for each 1-minute recording, between the daily amplitude in baseline GCamp6f (ΔF24h) and the signal amplitude over 1 minute (ΔF1min), for each mouse SCN (colored lines) and the aggregate data (black bars). (g) and (h) Daily profiles in GCamp6f baseline and topline (as depicted in a) from two representative SCN neurons, with larger signal amplitude during the day (g) or night (h). The solid lines represent the best cosine wave for each dataset.
