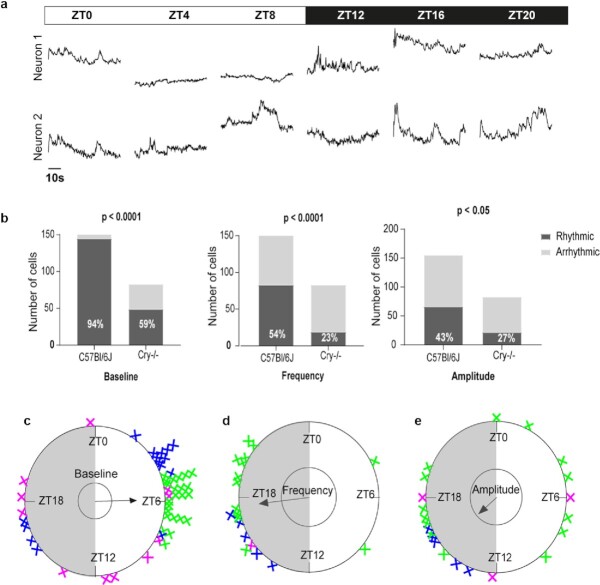
Fig. 3.
Daily variations in slow and fast Ca2+i dynamics in Cry1-/- Cry2-/- mice. (a) Longitudinal 1-minute recordings of GCamp6f fluorescence over 1 day–night cycle, from two SCN neurons of one Cry1-/- Cry2-/- mouse. (b) Quantitation of SCN neurons exhibiting a significant daily rhythm in GCamp6f baseline level (left), spike frequency (middle), and signal amplitude (right), in C57Bl/6 J and Cry1-/- Cry2-/- mice. The P-values indicate a significant genotype-dependence in the proportion of rhythmic neurons for each parameter (Fisher's exact contingency test). (c)–(e) Rayleigh plots of significant individual daily peak phases in baseline level (c), spike frequency (d), and signal amplitude (e) measured from three Cry1-/- Cry2-/- mice. Each color represents neurons from one mouse, examples in (a) were selected from the mouse color-coded in blue.

