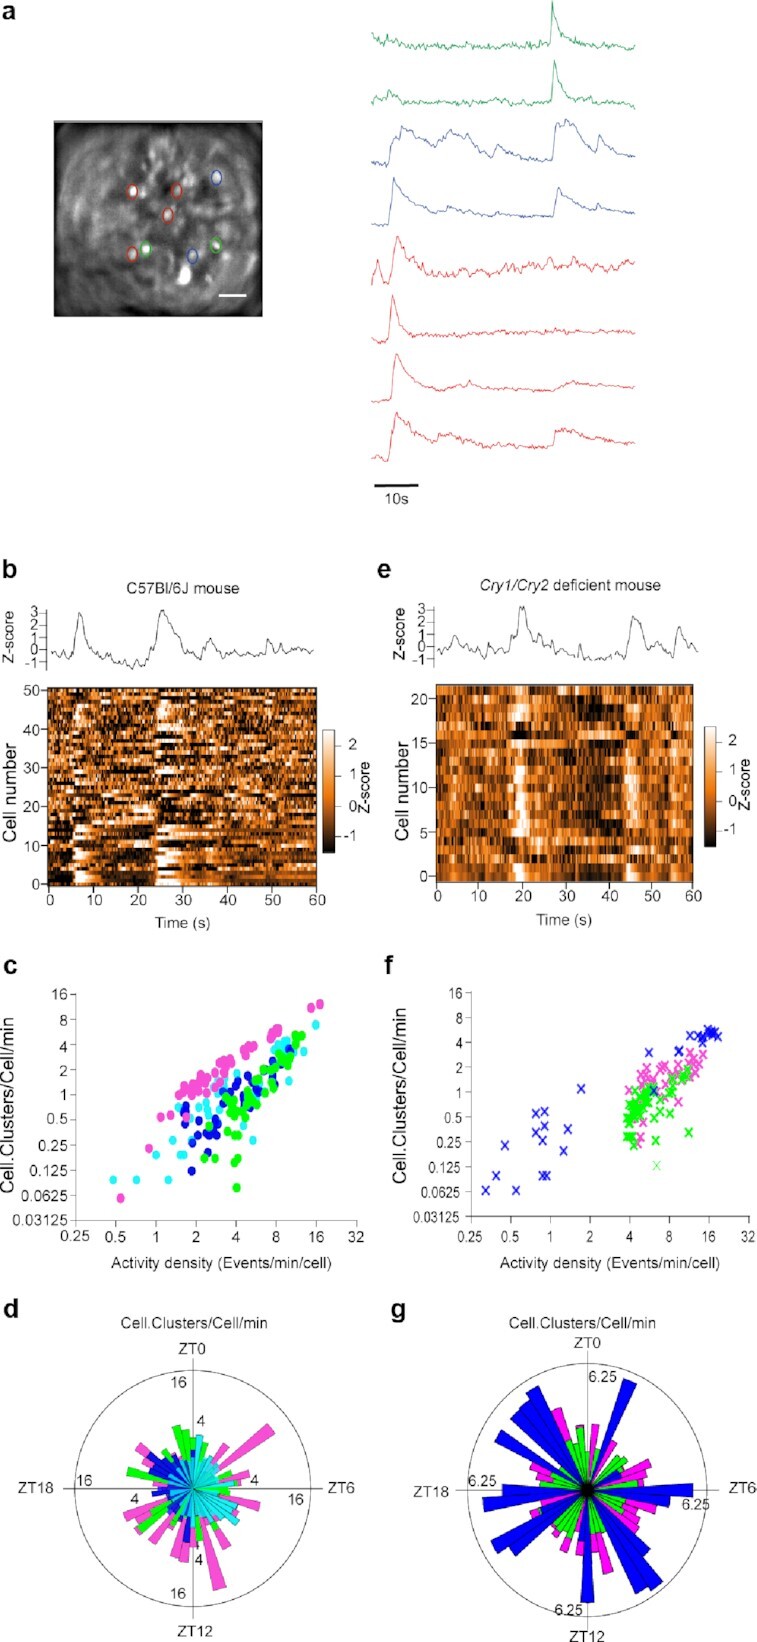
Fig. 4.

Synchronous fast Ca2+i spikes depicted clock-independent cell–cell signaling in the SCN. (a) 1-minute recordings of GCamp6f fluorescence from SCN neurons in a same field of view. Note the occurrence of synchronous spikes in neuron subsets (delineated by three different colors). Scale bar, 100 µm. (b)–(g) Analysis of clusters of coactivity from the SCN of C57Bl/6 J (b)–(d) and Cry1-/- Cry2-/- (e)–(g) mice. (b) and (e) Global GCamp6f fluorescence (upper panel) and heat map of signal intensity from individual neurons (lower panel), recorded during 1 minute. (c), (d), (f), and (g) Extent of clusters of coactivity as a function of the density in activity (c) and (f) and time of day (d) and (g).
