Fig. 1.
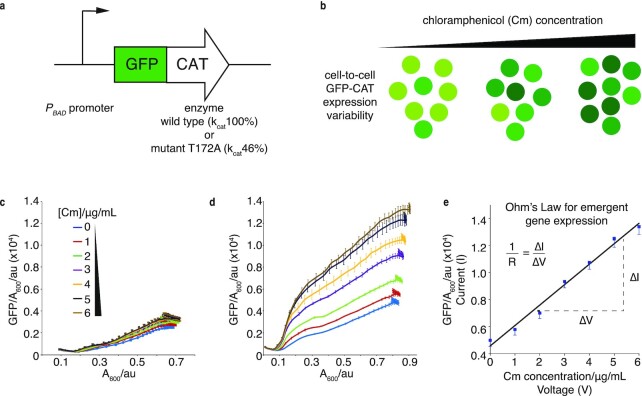
EGE increases linearly with rising antibiotic concentration in analogy to Ohm’s law. (a) Schematic of GFP-CAT expression cassettes used in this study with inducible (PBAD) promoter driving expression of WT or mutant catT172A (relative acetylation efficiencies of kcat100% and kcat 46%, respectively). (b) Schematic of EGE for antibiotic resistance. GFP-CAT concentration per cell is indicated by a range of light to dark green; three separate populations are shown where higher gfp-cat expression is spontaneously selected in the presence of increasing Cm concentration, to increase cell fitness. (c) and (d) Emergent gfp-cat expression with a weakly induced PBAD promoter (0.005% arabinose). Graphs show GFP/A600 per well of populations expressing genome-integrated wt gfp-cat (c) and mutant gfp-catT172A (d). These were treated with 0, 1, 2, 3, 4, 5, or 6 µg/ml Cm to induce EGE, monitored for 12 h and compared at corresponding Abs600; n = 3 biological replicates. (e) Ohm’s law analogy for EGE, where GFP-CAT expression is analogous to current (I), Cm concentration to voltage (V), and the slope of the linear relationship between these, representing cellular propensity to increase EGE, is analogous to conductance (1/R). The data points are the maximal EGE values in (d).

