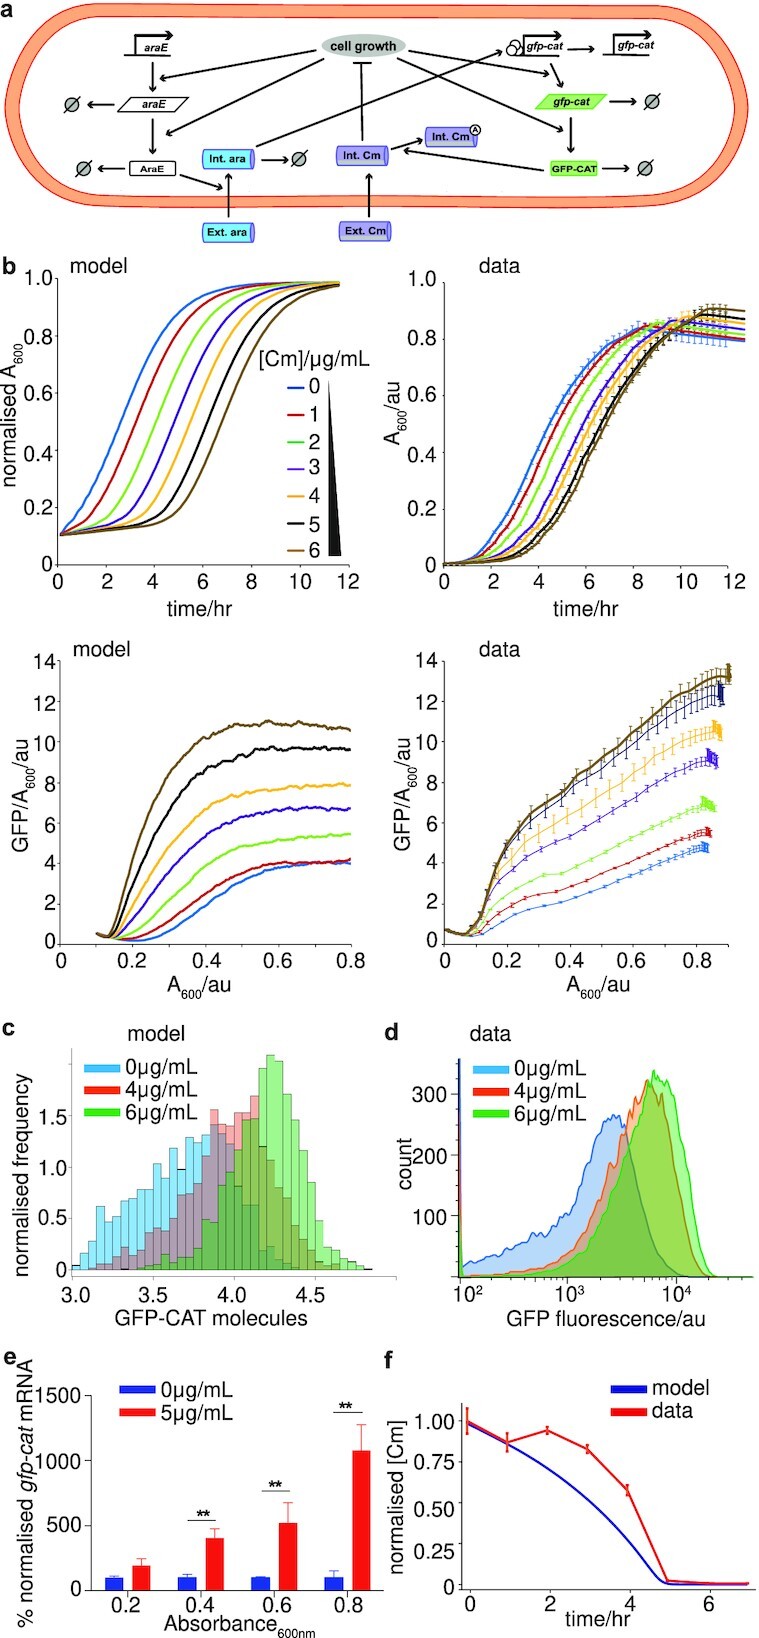
Fig. 2.

Experimental verification of the inducible promoter computational emergence model. (a) Schematic for mathematical modeling of the inducible promoter system for a single cell. The reactions capture gfp-cat expression and degradation, araE expression and degradation, arabinose import, degradation and activation of the PBAD promoter, as well as Cm import and acetylation by GFP-CAT. Intracellular dynamics were coupled to a second model scale, which captured cell division, partitioning and logistic growth of the cell population (more details in Appendix 2 and Supplementary Material Appendix, Figures S11–S14). (b) Comparing model outputs with experimental data for growth (normalized A600 data) and GFP-CAT molecules per cell (GFP/A600), for increasing Cm concentrations, over 12 h. Best fit parameters were taken from ABC parameter inference and initial conditions (initial number of cells and GFP expression levels) were taken from the experimental data displayed in right hand panels. mRNA levels were assumed to be zero initially. (c) and (d) Comparing model outputs with experimental data for population distributions of EGE. GFP-CAT molecule distributions are shown for increasing Cm concentrations. The x-axis in (c) is displayed on a log10 scale and the y-axis is scaled such that the total area of the histograms sum to 1. The flow cytometry analysis (d) of the genome-integrated gfp-catT172A mutant matches the model prediction (c). Cells in (d) were weakly induced with 0.005% arabinose, treated with 0, 4, or 6 µg/ml Cm for 12 h, and fixed in 2% paraformaldehyde; n = 3 biological replicates. (e) RT-qPCR assay of gfp-catT172A mRNA expression in populations induced with 0.005% arabinose, treated with 0 (blue) or 5 (red) µg/ml Cm, and harvested at A600 of 0.2, 0.4, 0.6, and 0.8 (Mean ± SEM; n= 3 biological replicates). Asterisks represent P-values: ** = P < 0.01. (f) Cm concentration in cultures of the genome-integrated gfp-catT172A mutant strain, measured by LC-MS at 1-h intervals (orange). This is compared with the predicted Cm concentration from simulation of the refined inducible promoter model (Supplementary Material Appendix, Figure S23). Both time series are normalized to their maximal values.
