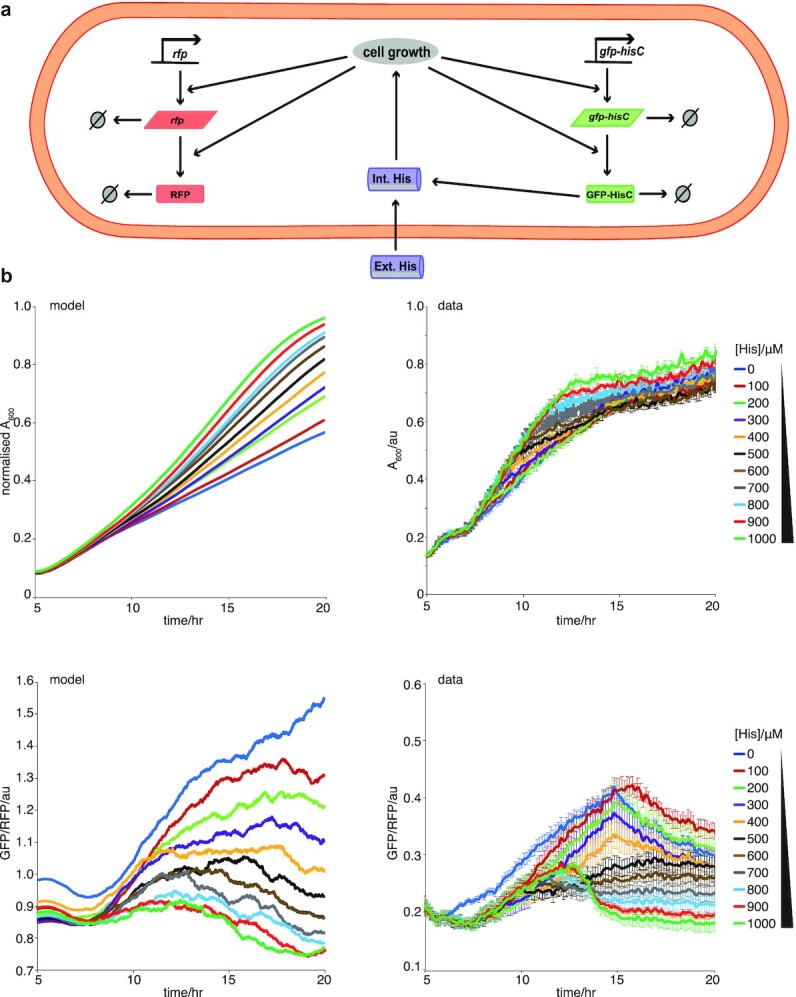
Fig. 4.

Experimental verification of inducible expression model of EGE of gfp-hisC in E. coli OSU12-hisC grown in decreasing concentrations of histidine in the growth medium. (a) Schematic for mathematical modeling of the histidine depletion system for a single cell. The reactions capture gfp-hisC and rfp expression and degradation, as well as histidine (His) import. Intracellular dynamics were coupled to a second model scale, which captured cell division, partitioning, and logistic growth of the cell population (more details in Appendix 2 and Supplementary Material Appendix, Figure S22). (b) Comparing model outputs with experimental data for growth (normalized A600 data) and GFP-HISC molecules per cell (GFP/A600), for decreasing His concentrations, over 20 h. Time series showing total number of cells from simulations of an inducible promoter model normalized by carrying capacity (upper left panel) and corresponding experimental mean A600 data (upper right panel) for 11 histidine conditions ranging from 0 to 1,000 µM for a time period of 20 h. Lower plots show the corresponding time series of gfp expression normalized to rfp expression for the same conditions with the left plot showing the model output and the right plot showing the experimental mean. Best fit parameter were used from ABC parameter inference and initial conditions (initial number of cells, gfp expression, and rfp expression levels) were taken from data displayed in right hand side panels. mRNA levels were assumed to be zero initially.
