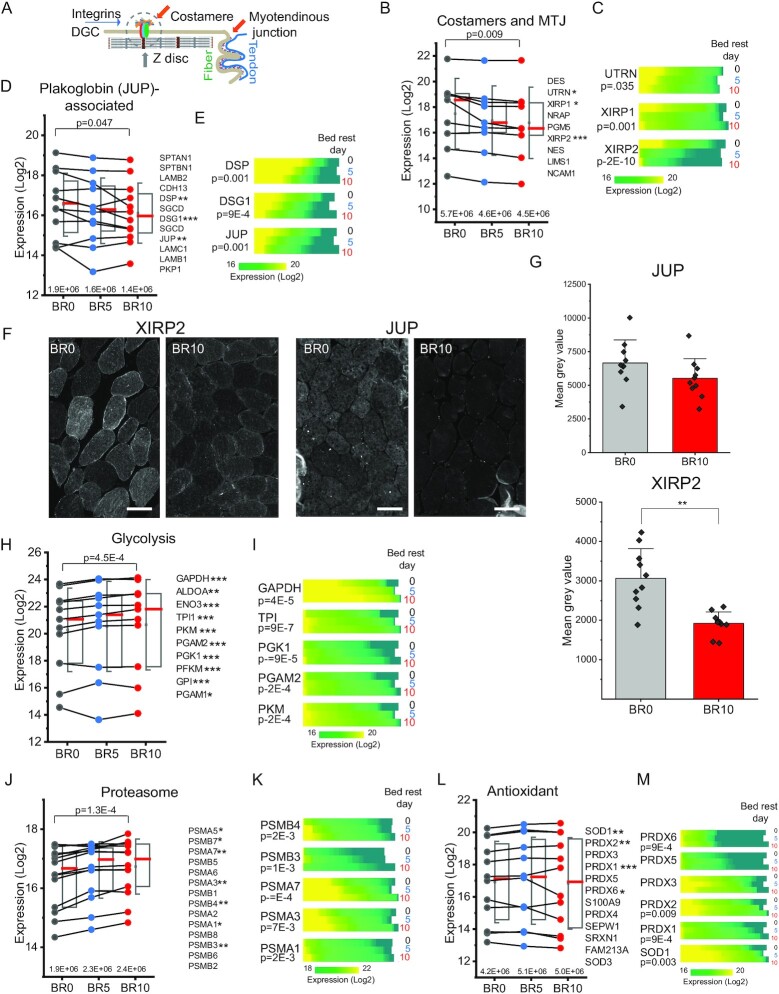
Fig. 2.
Time-dependent proteomics features of muscle fiber disuse and unloading. (A) Schematic representation of costameres and MTJ involved in muscle fiber- and muscle fiber-tendon adhesion. Some proteins mentioned in the text, such as XIRP1, XIRP2, and NRAP are located both at costameres and MTJ. (B) Trendlines with half boxplots of the expression of proteins enriched at the costameres and MTJ, with overall statistical significance on top (BR10 vs. BR0, paired T-test). Box shows median in red, 75th and 25th percentile, whiskers SD. The protein list on the right is ordered by decreasing expression at BR10. Proteins with statistically significant expression difference in fibers before bed rest (BR0) and at BR10 are marked with asterisks (*P < 0.05, ** P < 0.01, and *** P < 0.0001). T-test, N = 78 fibers at BR0 and 80 at BR10. Each fiber corresponds to one raw file and is considered as an independent experiment. The summed intensity of the proteins at each time point is shown above the x-axis. (C) Heatmap of the expression in all fibers of three MTJ proteins with significant decrease upon unloading, UTRN, XIRP1, and XIRP2. Protein expression (LFQ intensity, Log2, color scale at bottom) is split into horizontal blocks, showing all fibers at each time of bed rest, as indicated on the right. BR0, 78 fibers, BR5 75, and BR10 80. P-value (T-test, BR10 vs. BR0) is reported on the left. (D) Trendlines with half boxplots of the expression of proteins enriched at the costameres in complex with plakoglobin (JUP). See panel (B). (E) Heatmap showing the expression in all fibers of three costameric proteins with significant decrease upon unloading (see panel C), DSP, DSG, and JUP. See panel (C). (F) Immunofluorescence analysis comparing the expression of XIRP2 and JUP at BR0 and BR10 in muscle biopsies of bed rest subjects. Representative images of the staining at BR0 and BR10 of the same subject. Brightness was digitally enhanced by an identical factor for paired images (XIRP2 300, XIRP1 150, and JUP 100). (G) Bar graphs of median gray value in the stained biopsy of all subjects (N = 10, > 50 fibers/subject, T-test). (H) Trendlines with half boxplots of the expression of glycolytic enzymes. See panel (B). (I) Heatmap showing the expression in all fibers of five glycolytic enzymes with significant increase in expression upon unloading. See panel (C). (J) Trendlines with half boxplots of the expression of proteasome proteins. See panel (B). (K) Heatmap showing the expression in all fibers of five proteasome subunits with significant increase in expression upon unloading See panel (C). (L) Trendlines with half boxplots of the expression of proteins involved in protection from reactive oxygen species (keywords annotation antioxidant). Description as in (A). (M) Heatmap showing the expression in all fibers of six antioxidant enzymes with significant increase in expression upon unloading. Description as in (B).

