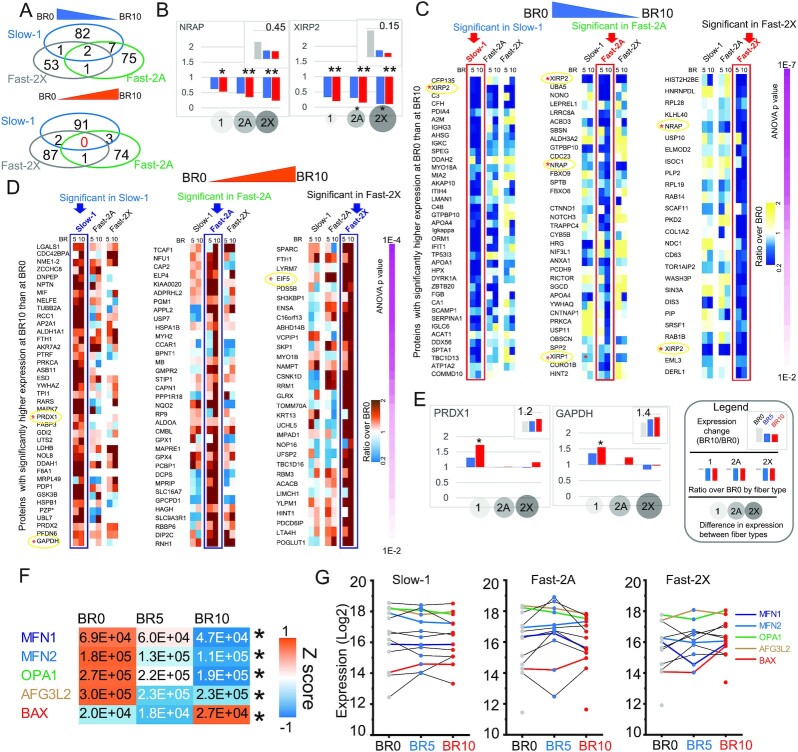
Fig. 3.
Fiber type-specific effects of muscle unloading. (A) Proteins with significantly lower (top) and higher (bottom) expression at BR10 compared to BR0. (B) Fiber type-resolved effects of muscle unloading on the two proteins significantly downregulated at BR10 in all three fiber types. The ratio between expression at BR10 and BR0 in all fibers (top graph), the ratio in individual pure fiber types (middle graph) and the relative expression in different fiber type (bottom circles) is shown as depicted in the legend next to panel (E). BR0, gray bars; BR5, blue bars; and BR10, red bars. T-test (*P < 0.05). (C) Heatmap showing the expression ratio (BR10/BR0) of proteins with expression BR0 > BR10 according to the color scale shown on the right. Only proteins with P-value < 0.01 (ANOVA and post hoc tests comparing only pure fibers of the same type) are shown in the heatmaps, the remaining proteins with 001 < P-value < 0.05 are listed in Table S8 (Supplementary Material). The proteins are ranked by P-value, as indicated on the right. For each fiber type, marked on top, the corresponding column in which the expression change is statistically significant is marked by a rectangle. (D) Heatmap showing the expression ratio (BR10/BR0) of proteins with expression BR0 < BR10 according to the color scale shown on the right. See panel (C) and Table S8 (Supplementary Material). (E) Fiber type-resolved effects of muscle unloading of two proteins upregulated by unloading only in type1-slow fibers. The ratio between expression at BR10 and BR0 in all fibers (top graph), the ratio in individual pure fiber types (middle graph), and the relative expression in different fiber type (bottom circles) is shown as depicted in the legend. BR0, gray bars; BR5, blue bars; and BR10, red bars. T-test (*P < 0.05). See detailed legend in panel (E). (F) Heatmap with expression (LFQ (explain) intensity) of five proteins involved in mitochondrial network remodeling, with significantly different expression between BR0 and BR10 (marked by asterisk on the right). Color scale, Z score as indicated. BR0 N = 78, BR5 N = 75, and BR10 N-80. (G) Profile plots by fiber type of the expression of protein annotated as “mitochondrial fusion” and “fission” (GOBP). The protein list, ordered by expression at day 10 in decreasing order, is shown on the right. The profiles and names of the five proteins with significant expression are labeled in colors as shown on the right.

