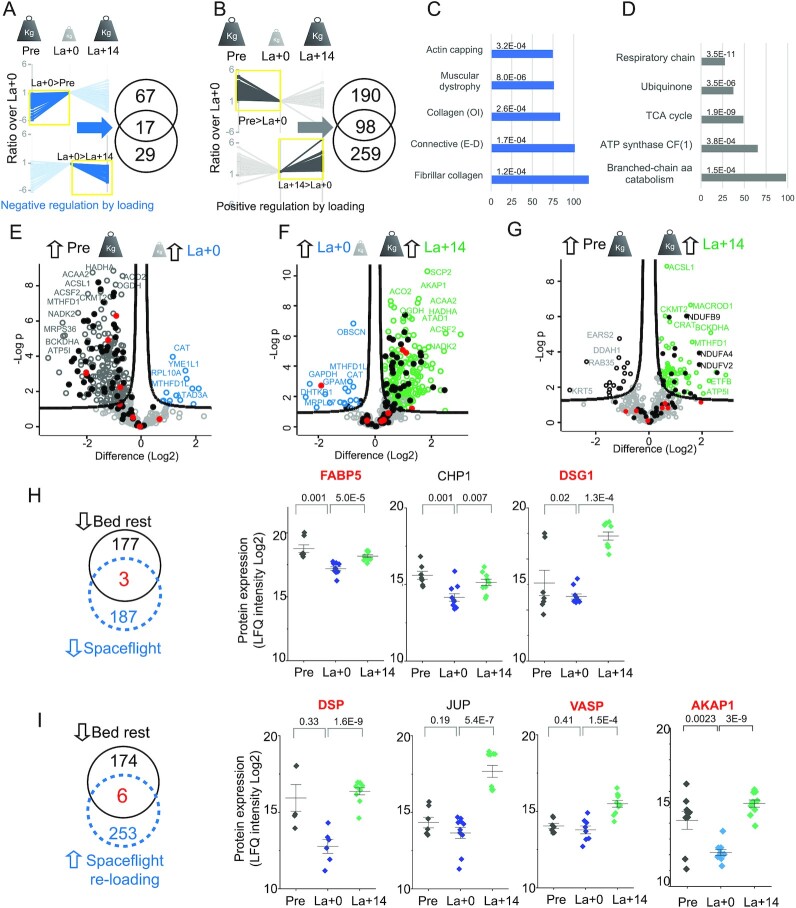
Fig. 4.
Effects of spaceflight on the whole muscle and mitochondrial proteome. (A) Left, expression ratio (Log2) of proteins negatively regulated by weight load, with higher expression at La + 0 compared to preflight (ANOVA, significant in both astronauts). The darker line color and yellow box indicate the side with statistically significant expression difference (ANOVA and Tukey's HSD, N = 5). Bottom, the same analysis for proteins decreasing their expression upon reloading on Earth. Weight load changes during the phases of the mission are schematically represented on top. Right, number of proteins significantly up-and downregulated shown in the corresponding profile plots, intersection shows the number of proteins with significant, opposite expression changes in both phases. (B) Same analysis for proteins positively regulated by weight load. (C) Annotation enrichments among proteins negatively regulated by weight load (intersection of Venn diagram in panel A, N = 17 proteins). (D) Annotation enrichments among proteins positively regulated by weight load (intersection of Venn diagram in panel B, N = 98 proteins). OI, osteogenesis imperfecta. E–D, Ehlers–Dannlos syndrome. (E) Comparison of the muscle mitochondrial proteome (Mitocarta 2) of astronauts from the biopsy before mission (Pre, Earth gravity, represented by large weighing weight) and on the day of landing after 6 months on the ISS (La + 0, microgravity, represented by small weighing weight). A subset of proteins with large expression difference in the two conditions is labeled with their gene name. Respiratory chain proteins are marked by filled dots. Red dots, encoded by mtDNA. (F) Comparison of the muscle mitochondrial proteome from the biopsy before mission with that taken after 14 days of normal daily activity on Earth postflight (La + 14, see also E). (G) Comparison of the muscle mitochondrial proteome from the biopsy on the day of landing with that taken after 14 days of normal daily activity on Earth postflight (see E and F). (H) Left, number of proteins with significant downregulation after bed rest (black) and after space flight (blue dashed), with three common proteins. Proteins lists derive from ANOVA (Bed rest, N = 83 and 80 single fibers. Astronauts, N = 10, 2 subjects, five technical replicates). Right, expression of the three common proteins in skeletal muscle before (Pre), on the day of landing (La + 0) and 14 days after landing (La + 14). N = 10, 2 subjects, five technical replicates. *, P < 0.05, **, P < 0.01, T-test. Protein name in red indicates common to panel I. (I) Left, number of proteins with significant downregulation after bed rest (left, red filled dots) and upregulated in astronauts after 14 days of normal daily activity on Earth postflight (right, blue filled squares), with six common proteins. Right, expression of four of the six common proteins, the other two are in panel H (name in red). See panel H. (G) Column scatter detailing the expression of JUP and its interactor DSG1/desmoglein and DSP/desmoplakin in skeletal muscle before (Pre), on the day of landing (La + 0) and 14 days after landing (La + 14). N = 10, two subjects, five technical replicates. *, P < 0.05, **, P < 0.01, T-test. (H) Proteins with significant upregulation after bed rest (left, red filled dots) and downregulated in astronauts after 14 days of normal daily activity on Earth postflight (right, blue filled squares). See panel (E).

