Fig. 1.
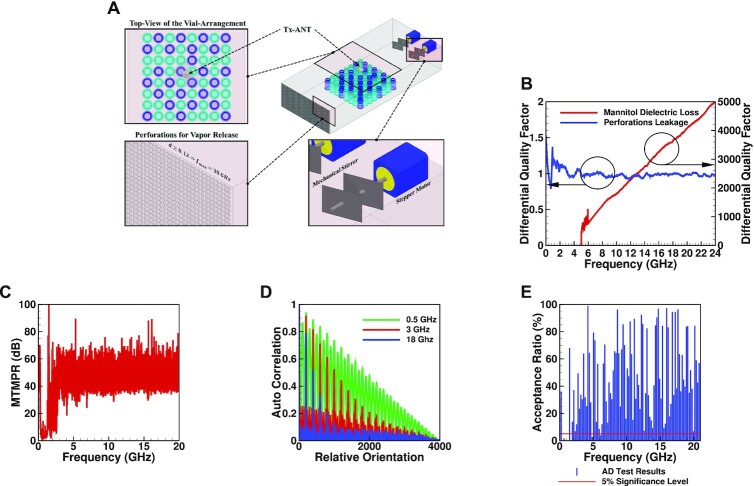
The dry-lab experiments setup and results. (A) A 3D illustration of the designed auxiliary chamber (AUXC) with three closeups showing the mechanical stirrers (MS) for creating a statistical EM environment (bottom-right), the perforations for vapor flow (bottom-left), and a top view of a product batch with vials selected for moisture analysis in dark-blue (top-left). (B) The measured differential quality factors that evaluate the leakage due to perforations and the behavior of the dielectric loss factor of mannitol at −45°C vs. frequency. (C) The maximum-to-minimum power ratio (MTMPR) evaluated the field variations in the SEM environment. (D) The autocorrelation between the different EM field structures evaluates the independence between the different promoted field structures at 0.5, 3, and 18 GHz. (E) The Anderson Darling (AD) statistical test results are used to measure the lowest usable frequency (LUF) of the auxiliary chamber (AUXC).

