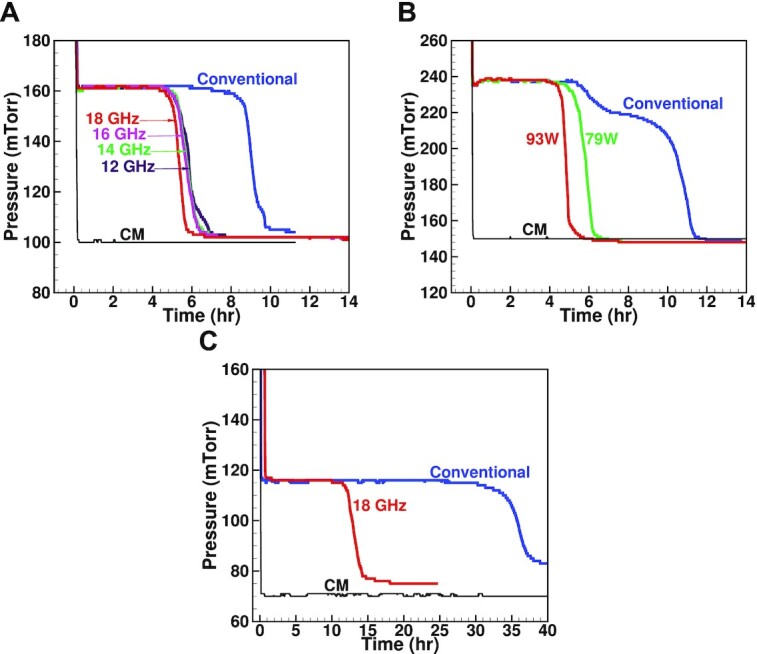
Fig. 3.

The CM and Pirani gauge pressure measurements vs. primary drying time for different lyophilization cycles. (A) A conventional cycle and four microwave-assisted cycles of mannitol (5% v/v, 6R-Vial, 3 ml fill volume, and 114 vials) at 12, 14, 16, and 18 GHz. (B) A conventional cycle and two microwave-assisted cycles of mannitol (5% v/v, 6R-Vial, 3 ml fill volume, and 100 vials) at different PA output powers, 79 and 93 W. (C) A conventional and microwave-assisted (71 W) lyophilization cycles of sucrose (5% v/v, 6R Vial, 3 ml fill volume, and 64 vials).
